Mallard Metrics
Self-hosted, privacy-focused web analytics powered by DuckDB and the behavioral extension.
Single binary. Single process. Zero external dependencies.
What is Mallard Metrics?
Mallard Metrics is a lightweight, GDPR/CCPA-compliant alternative to cloud analytics platforms. It runs entirely on your infrastructure, stores no personally identifiable information, and requires no cookies or consent banners.
Built in Rust for predictable, low resource usage. The embedded DuckDB database — combined with the behavioral extension — provides SQL-native behavioral analytics: funnels, retention cohorts, session analysis, sequence matching, and flow analysis. No third-party services involved.
Core Properties
| Property | Value |
|---|---|
| Language | Rust (MSRV 1.94.0) |
| Web framework | Axum 0.8.x |
| Database | DuckDB (disk-based, embedded, in-process) |
| Analytics | behavioral extension (loaded at runtime) |
| Storage | Date-partitioned Parquet files (ZSTD-compressed) |
| Frontend | Preact + HTM (no build step, embedded in binary) |
| Deployment | Static musl binary, FROM scratch Docker image |
| Tests | 333 passing (262 unit + 71 integration) |
Key Features
Privacy by Design
- No cookies — Visitor identification uses a daily-rotating HMAC-SHA256 hash of
IP + User-Agent + daily salt. - No PII storage — IP addresses are hashed and discarded; they are never written to disk.
- Daily salt rotation — Visitor IDs change every 24 hours, preventing long-term tracking.
- Privacy-preserving — Pseudonymous visitor IDs; no cookies; no raw IP storage. See Security & Privacy for details.
Single Binary Deployment
- One process handles ingestion, storage, querying, authentication, and the dashboard.
- DuckDB is embedded — no separate database to install or operate.
FROM scratchDocker image: the binary is the only file in the container.- WAL-based durability: disk-backed DuckDB preserves hot events through crashes.
Analytical Power
| Category | Capabilities |
|---|---|
| Core metrics | Unique visitors, pageviews, bounce rate, pages/session |
| Breakdowns | Pages, referrers, browsers, OS, devices, countries |
| Time-series | Hourly and daily aggregations |
| Funnel analysis | Multi-step conversion funnels via window_funnel() |
| Retention cohorts | Weekly retention grids via retention() |
| Session analytics | Duration, depth via sessionize() |
| Sequence matching | Behavioral patterns via sequence_match() |
| Flow analysis | Next-page navigation via sequence_next_node() |
Production Ready
- Argon2id authentication — Password-protected dashboard with cryptographic session tokens.
- API key management — Programmatic access with SHA-256 hashed keys (
mm_prefix), disk-persisted. - Rate limiting — Per-site token-bucket rate limiter on the ingestion endpoint.
- Query caching — TTL-based in-memory cache for analytics queries.
- Bot filtering — Automatic filtering of known bot User-Agents.
- GeoIP — MaxMind GeoLite2 integration with graceful fallback.
- Data retention — Configurable automatic cleanup of old Parquet partitions.
- Graceful shutdown — Buffered events are flushed before process exit.
- Prometheus metrics —
GET /metricsfor scraping with counters for ingestion, auth, cache, and rate limiting. - OWASP security headers — Including HSTS, CSP, Permissions-Policy, and X-Request-ID.
- CSRF protection — Origin/Referer validation on all state-mutating endpoints.
- Brute-force protection — Per-IP login lockout with configurable threshold and lockout duration.
- GDPR-friendly mode — Single
MALLARD_GDPR_MODE=truetoggle strips referrers, rounds timestamps, reduces GeoIP precision, and enables the Art. 17 data-erasure API.
When Should You Use Mallard Metrics?
Mallard Metrics is a good fit when you:
- Want full control over your analytics data on your own server.
- Need GDPR/CCPA compliance without third-party data processors.
- Are running a small-to-medium website and want low operational overhead.
- Need advanced behavioral analytics (funnels, retention, sequences) without a SaaS subscription.
- Want to demonstrate the power of DuckDB's
behavioralextension in a real-world production context.
It is not designed for:
- Multi-region distributed analytics at very high volume (millions of events/minute).
- Real-time dashboards with sub-second latency requirements.
- Replacing a full data warehouse.
Project Status
Mallard Metrics is actively developed and production-ready. See GitHub for the latest releases and issue tracker.
The behavioral extension powering advanced analytics is developed at github.com/tomtom215/duckdb-behavioral.
Quick Start
This guide gets Mallard Metrics running and collecting events in a few minutes.
Prerequisites
- Docker (recommended), or a Linux/macOS host with Rust 1.94+ for building from source.
- A web property you want to track.
Option 1: Docker (Recommended)
docker run -p 8000:8000 \
  -v mallard-data:/data \
  -e MALLARD_SECRET=your-random-32-char-secret \
  -e MALLARD_ADMIN_PASSWORD=your-dashboard-password \
  ghcr.io/tomtom215/mallard-metrics
Open http://localhost:8000 to access the dashboard.
Option 2: Docker Compose
Download docker-compose.yml from the repository root and run:
docker compose up -d
The compose file includes persistent storage, restart policy, and environment variable configuration. Set MALLARD_SECRET and MALLARD_ADMIN_PASSWORD in your shell or a .env file before running.
Option 3: Build from Source
git clone https://github.com/tomtom215/mallardmetrics
cd mallardmetrics
cargo build --release
./target/release/mallard-metrics mallard-metrics.toml.example
Note: The
bundledfeature for DuckDB means no external libduckdb is required. The build will take a few minutes the first time as DuckDB is compiled from source.
Step 2: Embed the Tracking Script
Add the tracking script to every page you want to track. Place it in the <head> or at the end of <body>:
<script
  async
  defer
  src="https://your-mallard-instance.com/mallard.js"
  data-domain="your-site.com">
</script>
Replace:
https://your-mallard-instance.comwith the URL of your Mallard Metrics instance.your-site.comwith the domain you configured insite_ids(or any domain ifsite_idsis empty).
The script is under 1 KB, loads asynchronously, sets no cookies, and automatically tracks pageview events including URL, referrer, UTM parameters, screen size, and User-Agent.
See Tracking Script for the full API including custom events and revenue tracking.
Step 3: Verify Events Are Arriving
Check the health endpoint:
curl http://localhost:8000/health
# ok

curl http://localhost:8000/health/detailed
# {"status":"ok","version":"0.1.0","buffered_events":3,...}
Events are held in a memory buffer before being flushed to disk. You can query the dashboard immediately — the events_all view unions the hot buffer and all persisted Parquet data automatically.
Step 4: Dashboard
Navigate to http://localhost:8000 in your browser.
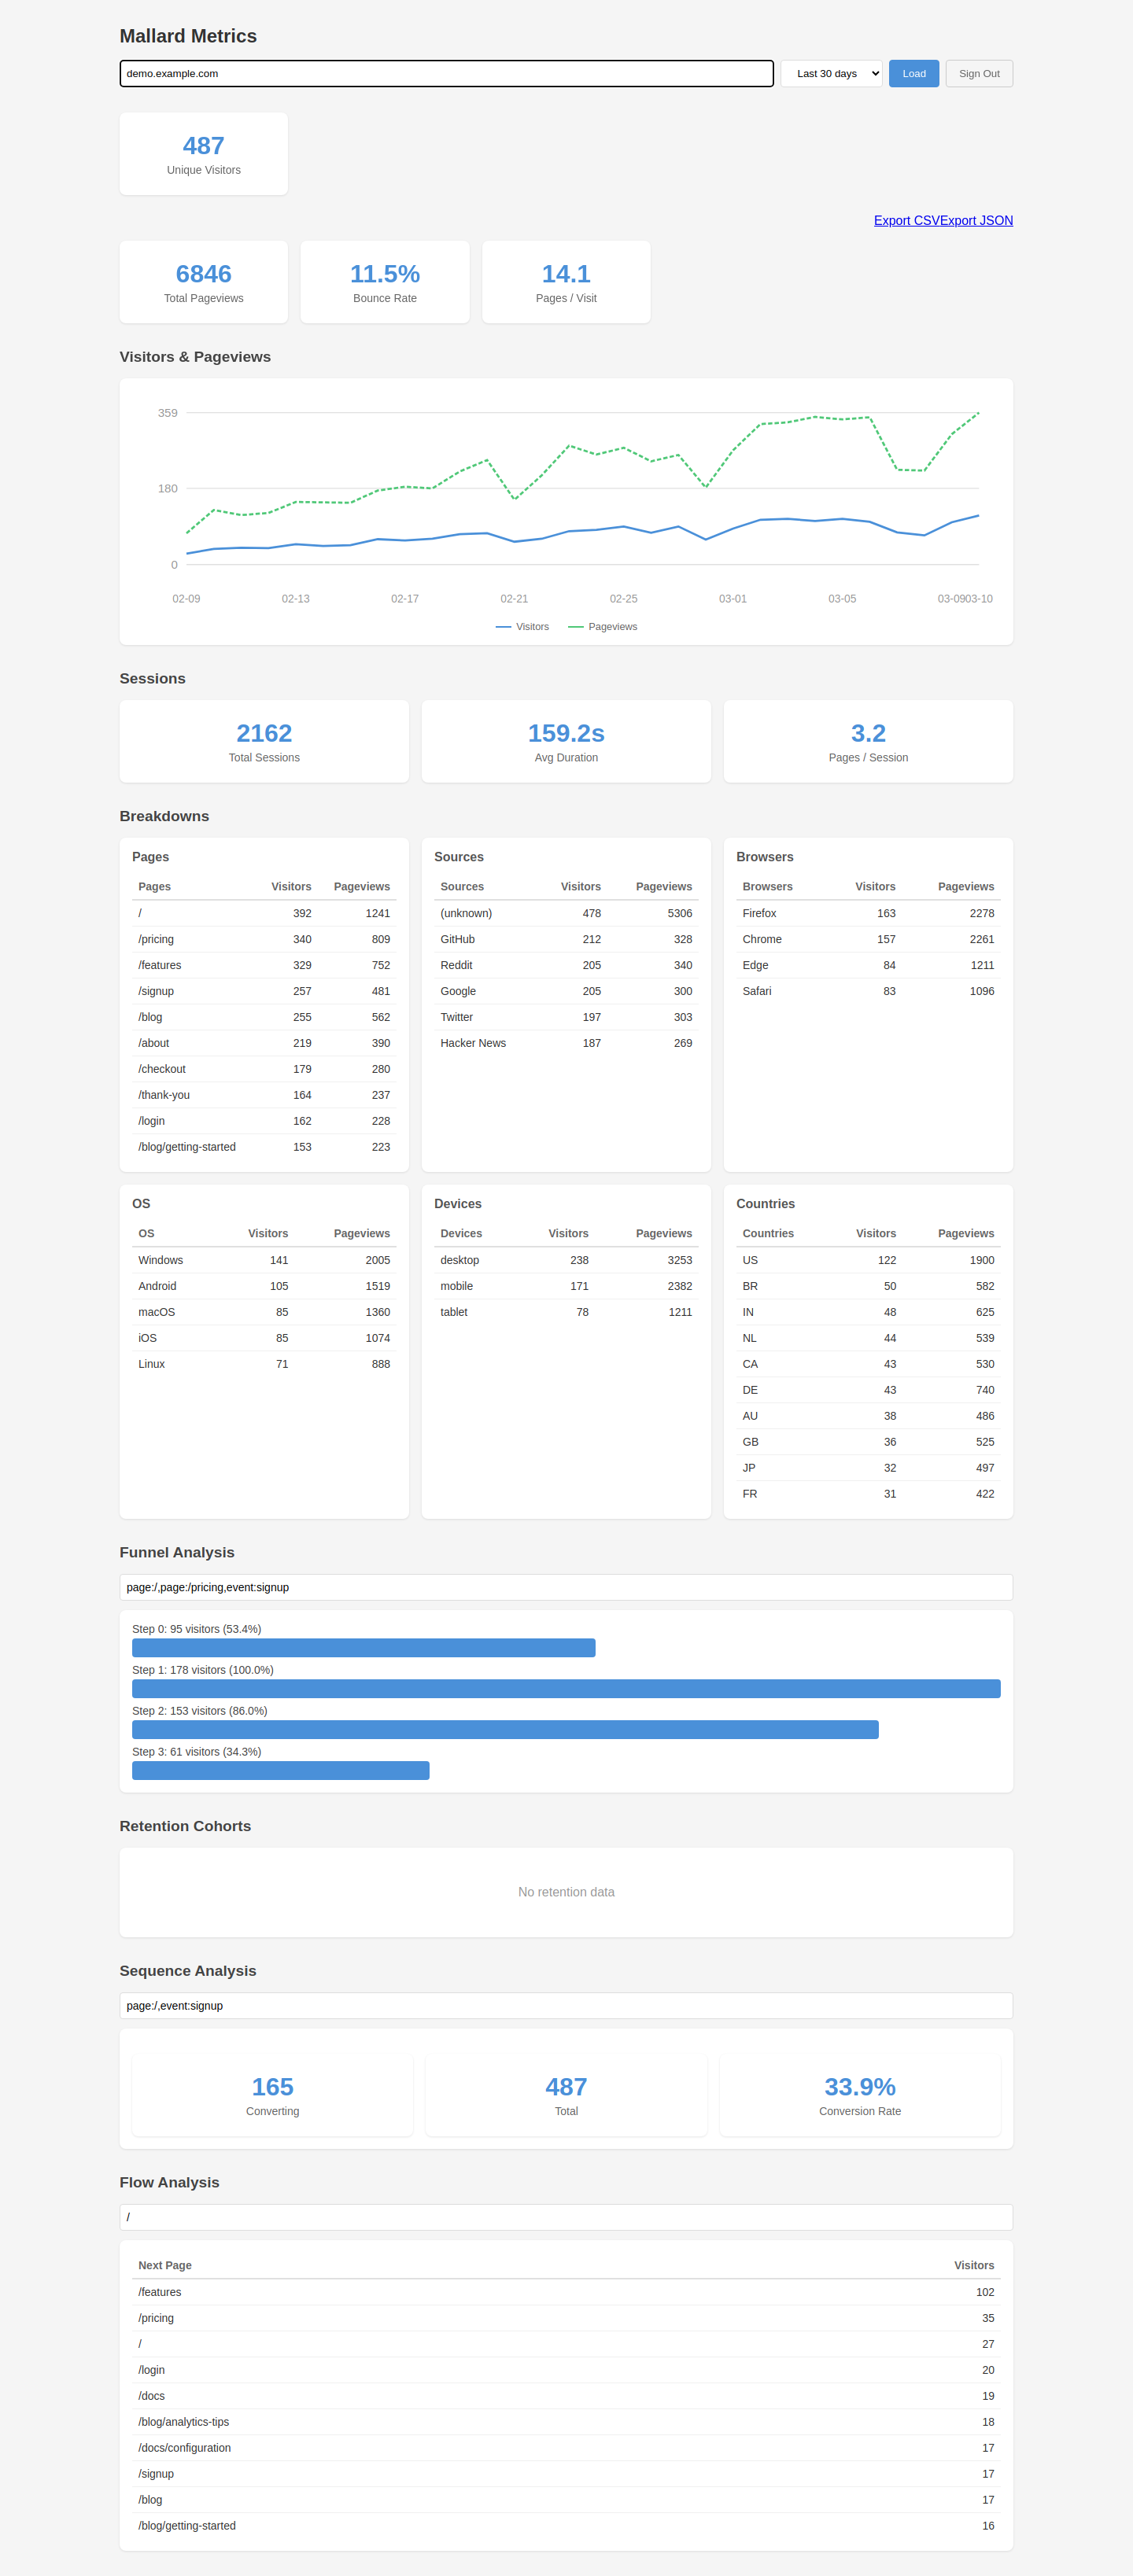
If you set MALLARD_ADMIN_PASSWORD, you will be prompted to log in. The dashboard shows:
- Overview — Unique visitors, pageviews, bounce rate, session metrics.
- Timeseries — Visitors and pageviews charted over your selected period.
- Breakdowns — Top pages, referrer sources, browsers, OS, devices, countries.
- Funnel — Define a conversion funnel with up to N steps.
- Retention — Weekly cohort retention grid.
- Sequences — Behavioral pattern matching and conversion rates.
- Flow — Next-page navigation from any starting page.
What's Next?
- Configuration — All configuration options.
- Tracking Script — Custom events and revenue tracking.
- API Reference — Integrate programmatically.
- Deployment — Production deployment guides.
Tracking Script
The Mallard Metrics tracking script (mallard.js) is served by the server at GET /mallard.js. It is under 1 KB, sets no cookies, and loads asynchronously.
Basic Embed
<script
  async
  defer
  src="https://your-instance.com/mallard.js"
  data-domain="your-site.com">
</script>
Attributes:
| Attribute | Required | Description |
|---|---|---|
data-domain | Yes | The site ID to record events under. Must match an entry in site_ids if that config option is set. |
Automatic Tracking
Once embedded, the script automatically fires a pageview event on every page load with the following data:
| Field | Source |
|---|---|
pathname | window.location.pathname + search + hash |
referrer | document.referrer |
screen_width | window.innerWidth (viewport width in pixels) |
| User-Agent | Sent in request header, parsed server-side |
| UTM parameters | Extracted from URL query string |
Custom Events
Use window.mallard(eventName, options) to track custom actions:
// Simple event
window.mallard('signup');

// Event with custom properties
window.mallard('purchase', {
  props: { plan: 'pro', coupon: 'SAVE20' }
});

// Revenue event
window.mallard('checkout', {
  revenue: 99.00,
  currency: 'USD'
});

// Event with callback
window.mallard('form_submit', {
  props: { form: 'contact' },
  callback: function() {
    console.log('Event recorded');
  }
});
Options
| Option | Type | Description |
|---|---|---|
props | object | Custom properties stored as JSON in the props column. Queryable via json_extract. |
revenue | number | Revenue amount (stored as DECIMAL(12,2)). |
currency | string | ISO 4217 currency code (3 characters, e.g. "USD"). |
callback | function | Called after the event is successfully recorded. |
Outbound Link Tracking
To track outbound link clicks, call window.mallard before navigating:
document.querySelectorAll('a[href^="http"]').forEach(function(link) {
  link.addEventListener('click', function(e) {
    window.mallard('outbound_link', {
      props: { url: link.href },
      callback: function() { window.location = link.href; }
    });
    e.preventDefault();
  });
});
Single-Page App Support
For SPAs, call window.mallard('pageview') manually after each route change:
// Example with a router
router.afterEach(function(to) {
  window.mallard('pageview');
});
Server-Side Events (No Script)
You can also send events directly to the API without the browser script. This is useful for server-rendered pages or background jobs:
curl -X POST https://your-instance.com/api/event \
  -H 'Content-Type: application/json' \
  -d '{
    "d": "your-site.com",
    "n": "signup",
    "u": "https://your-site.com/signup"
  }'
See Event Ingestion API for the full request schema.
Configuration
Mallard Metrics is configured through a TOML file and environment variables. All settings have sensible defaults; you can start without any configuration file.
Loading Configuration
Pass the path to a TOML file as the first command-line argument:
mallard-metrics /etc/mallard-metrics/config.toml
If no argument is provided, defaults are used.
Environment Variables
These two values are secrets and must not be stored in files committed to source control. Set them in your shell or a .env file:
| Variable | Required | Description |
|---|---|---|
MALLARD_SECRET | Recommended | HMAC key for visitor ID hashing. If unset, a UUID is auto-generated on first start and persisted to data_dir/.secret (survives restarts). Set explicitly in production for portability across hosts. |
MALLARD_ADMIN_PASSWORD | Recommended | Dashboard password. If unset, the dashboard is unauthenticated. |
MALLARD_MAX_LOGIN_ATTEMPTS | Optional | Override max_login_attempts at runtime. |
MALLARD_LOGIN_LOCKOUT | Optional | Override login_lockout_secs at runtime. |
MALLARD_LOG_FORMAT | Optional | Set to json for structured JSON log output. Omit or set to any other value for human-readable text logs. |
MALLARD_SECURE_COOKIES | Optional | Set to true to add the Secure flag to session cookies (required behind TLS). |
MALLARD_METRICS_TOKEN | Optional | Bearer token protecting the /metrics endpoint. |
MALLARD_GEOIP_DB | Optional | Path to MaxMind GeoLite2-City .mmdb file. |
MALLARD_DASHBOARD_ORIGIN | Optional | Restrict dashboard CORS and enable CSRF protection. |
MALLARD_MAX_CONCURRENT_QUERIES | Optional | Max concurrent analytical queries (default 10). Returns 429 when exhausted. |
MALLARD_CACHE_MAX_ENTRIES | Optional | Max query cache entries (default 10000). |
MALLARD_GDPR_MODE | Optional | Enable GDPR-friendly preset (see PRIVACY.md). |
MALLARD_GEOIP_PRECISION | Optional | GeoIP precision: city, region, country, or none. |
MALLARD_HOST | Optional | Server bind address (default 0.0.0.0). |
MALLARD_PORT | Optional | Server listen port (default 8000). |
MALLARD_DATA_DIR | Optional | Data directory for Parquet files and DuckDB (default data). |
MALLARD_FLUSH_COUNT | Optional | Events buffered before flushing to disk (default 1000). |
MALLARD_FLUSH_INTERVAL | Optional | Seconds between periodic buffer flushes (default 60). |
MALLARD_FILTER_BOTS | Optional | Filter known bot User-Agents (default true). |
MALLARD_RETENTION_DAYS | Optional | Auto-delete data older than N days; 0 = unlimited (default 0). |
MALLARD_SESSION_TTL | Optional | Dashboard session TTL in seconds (default 86400). |
MALLARD_SHUTDOWN_TIMEOUT | Optional | Graceful shutdown timeout in seconds (default 30). |
MALLARD_RATE_LIMIT | Optional | Max events/sec per site; 0 = unlimited (default 0). |
MALLARD_CACHE_TTL | Optional | Query cache TTL in seconds (default 60). |
MALLARD_STRIP_REFERRER_QUERY | Optional | Strip query/fragment from stored referrers (default false). |
MALLARD_ROUND_TIMESTAMPS | Optional | Round timestamps to the nearest hour (default false). |
MALLARD_SUPPRESS_VISITOR_ID | Optional | Replace HMAC hash with per-request UUID (default false). |
MALLARD_SUPPRESS_BROWSER_VERSION | Optional | Store browser name only (default false). |
MALLARD_SUPPRESS_OS_VERSION | Optional | Store OS name only (default false). |
MALLARD_SUPPRESS_SCREEN_SIZE | Optional | Omit screen width and device type (default false). |
TOML Configuration Reference
A complete example is shipped as mallard-metrics.toml.example. Every field has a default and is optional.
# Network binding
host = "0.0.0.0"   # default
port = 8000         # default

# Storage
data_dir = "data"   # relative or absolute path; events and Parquet files are stored here

# Event buffer
flush_event_count = 1000   # flush buffer to Parquet when this many events accumulate
flush_interval_secs = 60   # also flush on this interval (seconds)

# Site allowlist — leave empty to accept events from any origin
# site_ids = ["example.com", "other-site.org"]
site_ids = []

# GeoIP database (optional — gracefully skipped if missing)
# geoip_db_path = "/path/to/GeoLite2-City.mmdb"

# Dashboard CORS origin (optional — set when dashboard is on a different origin)
# dashboard_origin = "https://analytics.example.com"

# Bot filtering (default: true — filters known bot User-Agents from event ingestion)
filter_bots = true

# Data retention: delete Parquet partitions older than this many days
# Set to 0 for unlimited retention (default)
retention_days = 0

# Session authentication TTL in seconds (default: 86400 = 24 hours)
session_ttl_secs = 86400

# Brute-force protection: lock out an IP after this many failed login attempts (0 = disabled)
max_login_attempts = 5

# Duration in seconds to lock out an IP after exceeding max_login_attempts
login_lockout_secs = 300

# Graceful shutdown timeout in seconds (default: 30)
shutdown_timeout_secs = 30

# Ingestion rate limit per site_id (events/second, 0 = unlimited)
rate_limit_per_site = 0

# Query cache TTL in seconds (0 = no caching, default: 60)
cache_ttl_secs = 60

# Log format: "text" (default) or "json"
log_format = "text"

# Query cache max entries (0 = unlimited, default: 10000)
cache_max_entries = 10000

# Max concurrent analytics queries (0 = unlimited, default: 10)
# Excess requests receive HTTP 429
max_concurrent_queries = 10

# Cookie Secure flag (set to true when behind TLS)
secure_cookies = false

# ── GDPR / Privacy Flags ──────────────────────────────────────────────
# gdpr_mode = false            # convenience preset — enables all flags below
# strip_referrer_query = false  # strip ?query and #fragment from referrers
# round_timestamps = false      # round timestamps to the nearest hour
# suppress_visitor_id = false   # replace HMAC hash with per-request UUID
# suppress_browser_version = false
# suppress_os_version = false
# suppress_screen_size = false
# geoip_precision = "city"      # city | region | country | none
Configuration Field Details
host / port
The address and port the HTTP server listens on.
- Default:
0.0.0.0:8000 - To restrict to localhost:
host = "127.0.0.1"
data_dir
Root directory for all persistent data. Mallard Metrics creates subdirectories:
data/
└── events/
    └── site_id=example.com/
        └── date=2024-01-15/
            ├── 0001.parquet
            └── 0002.parquet
Parquet files are ZSTD-compressed. The directory is created automatically.
flush_event_count / flush_interval_secs
Events arrive into a memory buffer before being flushed to Parquet. Flushing happens when either threshold is reached. The buffer is also flushed on graceful shutdown.
- Lower values reduce data loss on crash; higher values reduce I/O.
- Queries always see both buffered (hot) and persisted (cold) data via the
events_allview.
site_ids
An allowlist of site identifiers. If non-empty, the Origin header of each ingestion request must exactly match one of the listed values. Requests from unlisted origins receive a 403 Forbidden response.
The comparison is exact: example.com matches https://example.com and http://example.com:8080 (with explicit port) but not example.com.other.io.
geoip_db_path
Path to a MaxMind GeoLite2-City .mmdb file. GeoLite2 databases are free for non-commercial use and available at maxmind.com.
If the file is not specified or does not exist, country/region/city fields are stored as NULL. This is the default behavior and does not cause any errors.
rate_limit_per_site
Maximum events per second accepted per site_id. Uses a token-bucket algorithm. Set to 0 (default) for no limit.
cache_ttl_secs
Query results for /api/stats/main and /api/stats/timeseries are cached in memory for this duration. Setting to 0 disables caching (useful for development). Default is 60 seconds.
retention_days
Parquet partition directories older than retention_days days are deleted automatically by a background task that runs daily. Set to 0 (default) for unlimited retention.
max_login_attempts / login_lockout_secs
Brute-force protection for the dashboard login endpoint. After max_login_attempts consecutive failures from the same IP, that IP is blocked for login_lockout_secs seconds. The server responds with 429 Too Many Requests and a Retry-After header during the lockout period.
max_login_attempts: Default5. Set to0to disable brute-force protection entirely.login_lockout_secs: Default300(5 minutes).
These can also be set via MALLARD_MAX_LOGIN_ATTEMPTS and MALLARD_LOGIN_LOCKOUT environment variables.
API Reference
Mallard Metrics exposes a JSON HTTP API. All endpoints are served by the same process as the dashboard.
Base URL
http://your-instance.com
Authentication
Most /api/stats/* and /api/keys/* endpoints require authentication. Provide one of:
- Session cookie — Set after
POST /api/auth/login. Sent automatically by browsers. - Bearer token — An API key in the
Authorization: Bearer mm_...header. - X-API-Key header — An API key in the
X-API-Key: mm_...header.
Endpoints that do not require authentication:
POST /api/event— Event ingestion (usesOriginallowlist instead).GET /api/event— Pixel tracking (same parameters as POST via query string; returns 1×1 GIF).POST /api/auth/login,POST /api/auth/setup,GET /api/auth/status,POST /api/auth/logoutGET /health,GET /health/ready,GET /health/detailedGET /metrics— optionally protected byMALLARD_METRICS_TOKENbearer token.GET /robots.txt,GET /.well-known/security.txtGET /(dashboard)
Content Type
All request bodies are application/json. All responses are application/json unless otherwise noted.
Error Responses
Errors are returned as JSON objects:
{
  "error": "human-readable description"
}
HTTP Status Codes
| Code | Meaning |
|---|---|
| 200 | Success |
| 202 | Event accepted (ingestion only) |
| 400 | Bad request — missing or invalid parameters |
| 401 | Unauthenticated — no valid session or API key |
| 403 | Forbidden — origin not in allowlist, or CSRF check failed |
| 404 | Not found |
| 408 | Request timeout (30-second server-side limit) |
| 409 | Conflict — resource already exists (e.g. password already set) |
| 413 | Request body too large (limit: 64 KB on ingestion routes) |
| 422 | Unprocessable — JSON validation failed |
| 429 | Rate limited or concurrent query limit — includes Retry-After header |
| 503 | Service unavailable — database not ready |
| 500 | Internal server error |
Sections
- Event Ingestion —
POST /api/event,GET /api/event - Analytics Stats —
GET /api/stats/* - Authentication —
POST /api/auth/*,GET /api/keys/*,POST /api/keys,DELETE /api/keys/* - Health & Metrics —
GET /health,GET /health/ready,GET /health/detailed,GET /metrics
Event Ingestion
POST /api/event
Records a single analytics event. This endpoint is called by the tracking script automatically and can also be called directly for server-side event recording.
Authentication: None required. The Origin header is validated against site_ids if that config option is set.
CORS: Fully permissive (Access-Control-Allow-Origin: *) to allow cross-origin calls from the tracking script.
Request Body
{
  "d": "example.com",
  "n": "pageview",
  "u": "https://example.com/pricing",
  "r": "https://google.com/",
  "w": 1920,
  "p": "{\"plan\": \"pro\"}",
  "ra": 99.00,
  "rc": "USD"
}
| Field | Type | Required | Description |
|---|---|---|---|
d | string | Yes | Domain / site identifier. Max 256 chars; alphanumeric plus ., -, _, : only. |
n | string | Yes | Event name (e.g. "pageview", "signup", "purchase"). |
u | string | Yes | Full URL of the page where the event occurred. |
r | string | No | Referrer URL. |
w | number | No | Screen width in pixels (for device-type detection). |
p | string | No | Custom properties as a JSON-encoded string. Stored in the props column and queryable via json_extract. |
ra | number | No | Revenue amount (stored as DECIMAL(12,2)). |
rc | string | No | ISO 4217 currency code (e.g. "USD", "EUR"). Maximum 3 characters. |
Response
HTTP/1.1 202 Accepted
The response body is empty. 202 means the event was accepted into the buffer. It will be flushed to Parquet on the next flush cycle or when the buffer threshold is reached.
Validation Errors
| Condition | Status |
|---|---|
Missing required field (d, n, or u) | 422 Unprocessable Entity |
Empty d, n, or u | 400 Bad Request |
d contains invalid characters or exceeds 256 chars | 400 Bad Request |
Field exceeds length limit (n > 256, u > 2048, r > 2048, p > 4096) | 400 Bad Request |
| Request body exceeds 64 KB | 413 Payload Too Large |
Origin header does not match site_ids | 403 Forbidden |
Rate limit exceeded for this site_id | 429 Too Many Requests |
GET /api/event
Pixel-tracking endpoint for environments where JavaScript is unavailable (email, AMP pages, RSS readers). Returns a 1x1 transparent GIF (43 bytes, Content-Type: image/gif).
Authentication: None required.
Query Parameters
| Parameter | Type | Required | Description |
|---|---|---|---|
d | string | Yes | Domain / site identifier. |
n | string | No | Event name (defaults to "pageview"). |
u | string | Yes | Full URL of the page. |
r | string | No | Referrer URL. |
w | number | No | Screen width in pixels. |
Revenue (ra, rc) and custom properties (p) are not supported on the GET endpoint.
Response
HTTP/1.1 200 OK
Content-Type: image/gif
Content-Length: 43
Usage
<img src="https://analytics.example.com/api/event?d=example.com&u=https://example.com/page" width="1" height="1" alt="">
Bot Filtering
When filter_bots = true (default), the server inspects the User-Agent header and discards the event if it matches known bot patterns. A 202 is still returned — the event is silently dropped rather than returning an error.
Privacy Processing
Before the event is stored:
- The client IP address is extracted from the request.
- A daily-rotating HMAC-SHA256
visitor_idis computed fromIP + User-Agent + today's UTC date + MALLARD_SECRET. - The IP address is discarded. It is never written to disk or the database.
Server-Side Example
curl -X POST https://your-instance.com/api/event \
  -H 'Content-Type: application/json' \
  -d '{
    "d": "example.com",
    "n": "server_signup",
    "u": "https://example.com/signup"
  }'
Analytics Stats API
All stats endpoints require authentication (session cookie, Authorization: Bearer API key, or X-API-Key header).
Query results for /api/stats/main and /api/stats/timeseries are cached per (site_id, period) for cache_ttl_secs seconds (default 60).
Common Query Parameters
| Parameter | Type | Description |
|---|---|---|
site_id | string | Required. The site to query. |
period | string | Optional. One of day, today, 7d, 30d, 90d. Defaults to 30d. |
start_date | string | Optional. Explicit start date (YYYY-MM-DD). Both start_date and end_date must be provided together; a lone date is ignored. Overrides period. |
end_date | string | Optional. Explicit end date (YYYY-MM-DD, exclusive). Maximum range: 366 days. |
site_id Validation
All endpoints validate site_id and return 400 Bad Request if any of the following conditions are not met:
- Non-empty string.
- At most 256 characters.
- ASCII alphanumeric characters plus
.,-,_, and:only.
// 400 response for invalid site_id
{"error": "Invalid site_id"}
GET /api/stats/main
Returns core aggregate metrics.
Response
{
  "unique_visitors": 1423,
  "total_pageviews": 5812,
  "bounce_rate": 0.42,
  "avg_visit_duration_secs": 0.0,
  "pages_per_visit": 4.08
}
| Field | Type | Notes |
|---|---|---|
unique_visitors | integer | Distinct visitor_id values in the period. |
total_pageviews | integer | Events where event_name = 'pageview'. |
bounce_rate | float | Sessions with exactly one pageview / total sessions. Requires behavioral extension; returns 0.0 if unavailable. |
avg_visit_duration_secs | float | Always 0.0 in this version (requires behavioral extension integration; computed separately via /api/stats/sessions). |
pages_per_visit | float | total_pageviews / unique_visitors. |
GET /api/stats/timeseries
Returns visitors and pageviews bucketed by time.
Granularity is determined automatically from the period: day/today returns hourly buckets; all other periods return daily buckets.
Response
[
  {"date": "2024-01-15", "visitors": 142, "pageviews": 518},
  {"date": "2024-01-16", "visitors": 167, "pageviews": 603}
]
For period=day the date field includes the hour (e.g. "2024-01-15 10:00").
GET /api/stats/breakdown/{dimension}
Returns visitor and pageview counts grouped by a single dimension.
Dimensions
| Path | Grouped by |
|---|---|
/breakdown/pages | pathname |
/breakdown/sources | referrer_source |
/breakdown/browsers | browser |
/breakdown/os | os |
/breakdown/devices | device_type |
/breakdown/countries | country_code |
Additional Parameters
| Parameter | Type | Description |
|---|---|---|
limit | integer | Maximum rows to return. Default 10, maximum 1000. Returns 400 if exceeded. |
Response
[
  {"value": "/pricing", "visitors": 312, "pageviews": 489},
  {"value": "/about",   "visitors": 201, "pageviews": 247}
]
Unknown/null dimension values are represented as "(unknown)".
GET /api/stats/sessions
Returns session-level aggregates using the sessionize behavioral function.
Requires the behavioral extension. Returns zeroes if the extension is not loaded.
Response
{
  "total_sessions": 892,
  "avg_session_duration_secs": 124.7,
  "avg_pages_per_session": 3.2
}
GET /api/stats/funnel
Returns a conversion funnel where each step is a filter condition.
Additional Parameters
| Parameter | Type | Description |
|---|---|---|
steps | string | Comma-separated list of steps. Format: page:/path or event:name. |
window | string | Session window duration. Default "1 day". Must be of the form N unit (e.g. "30 minutes", "2 hours"). |
Step Format
| Format | Meaning |
|---|---|
page:/pricing | pathname = '/pricing' |
event:signup | event_name = 'signup' |
Example Request
GET /api/stats/funnel?site_id=example.com&steps=page:/pricing,event:signup&window=1+hour
Response
[
  {"step": 1, "visitors": 500},
  {"step": 2, "visitors": 120}
]
Requires behavioral extension. Returns empty array if unavailable.
GET /api/stats/retention
Returns weekly retention cohorts using the retention behavioral function.
Additional Parameters
| Parameter | Type | Description |
|---|---|---|
weeks | integer | Number of cohort weeks to compute. Range: 1–52. Default 4. |
Response
[
  {
    "cohort_date": "2024-01-08",
    "retained": [true, true, false, true]
  }
]
Each retained boolean corresponds to one cohort week.
Requires behavioral extension. Returns empty array if unavailable.
GET /api/stats/sequences
Returns conversion metrics for a sequence of behavioral steps using sequence_match.
Additional Parameters
| Parameter | Type | Description |
|---|---|---|
steps | string | Comma-separated steps in page:/path or event:name format. Minimum 2 steps required. |
Response
{
  "converting_visitors": 89,
  "total_visitors": 500,
  "conversion_rate": 0.178
}
Requires behavioral extension. Returns zeroes if unavailable.
GET /api/stats/flow
Returns the most common next pages after a given starting page using sequence_next_node.
Additional Parameters
| Parameter | Type | Description |
|---|---|---|
page | string | The target page path to start from (e.g. /pricing). |
Response
[
  {"next_page": "/signup",  "visitors": 234},
  {"next_page": "/contact", "visitors": 89}
]
Returns up to 10 results. Requires behavioral extension.
GET /api/stats/export
Exports daily aggregated stats as CSV or JSON.
Additional Parameters
| Parameter | Type | Description |
|---|---|---|
format | string | csv (default) or json. Any other value returns 400. |
CSV Response
date,visitors,pageviews,top_page,top_source
2024-01-15,142,518,/pricing,(direct)
2024-01-16,167,603,/pricing,google
CSV fields that might trigger formula injection (start with =, +, -, @) are prefixed with a single quote.
Content-Disposition: attachment; filename="export.csv" is set so browsers prompt a download.
JSON Response
[
  {
    "date": "2024-01-15",
    "visitors": 142,
    "pageviews": 518,
    "top_page": "/pricing",
    "top_source": "(direct)"
  }
]
top_page and top_source reflect the single highest-traffic page and referrer source for the entire queried period, not per-day.
Authentication API
Mallard Metrics supports two forms of authentication:
- Session cookies — For human dashboard users.
- API keys — For programmatic access (CI/CD, integrations, monitoring).
Dashboard Authentication
POST /api/auth/setup
Sets the admin password for the first time. Returns 409 Conflict if a password is already configured.
No authentication required.
// Request — password must be at least 8 characters
{"password": "your-secure-password"}

// Response 200 — also sets HttpOnly, SameSite=Strict cookie mm_session
{"token": "<session-token>"}

// Response 400 — password too short
{"error": "Password must be at least 8 characters"}

// Response 409 — password already configured
{"error": "Admin password already configured"}
Passwords are hashed with Argon2id before storage. The plaintext password is never persisted.
POST /api/auth/login
Authenticates with the admin password and creates a session.
No authentication required.
// Request
{"password": "your-secure-password"}

// Response 200 — sets HttpOnly, SameSite=Strict cookie mm_session
{"token": "<session-token>"}

// Response 400 — no password configured yet
{"error": "No admin password configured. Use /api/auth/setup first."}

// Response 401 — wrong password
{"error": "Invalid password"}

// Response 429 — Too Many Requests (IP locked out after max failed attempts)
// Retry-After header contains the remaining lockout seconds
{"error": "Too many failed login attempts. Try again later."}
Sessions are stored in memory and expire after session_ttl_secs (default 24 hours). Sessions are cleared on server restart.
Brute-force protection: After max_login_attempts (default 5) consecutive failures from the same IP, the IP is locked out for login_lockout_secs (default 300 seconds). A successful login clears the failure count. Configure via MALLARD_MAX_LOGIN_ATTEMPTS and MALLARD_LOGIN_LOCKOUT environment variables, or the corresponding TOML fields. Set max_login_attempts = 0 to disable.
POST /api/auth/logout
Invalidates the current session.
No authentication required. If a valid session cookie is present, it is invalidated. Otherwise the endpoint is a no-op (always returns 200).
// Response 200 — clears mm_session cookie
{"status": "logged_out"}
GET /api/auth/status
Returns the current authentication state.
// No password configured (open access mode)
{"setup_required": true, "authenticated": true}

// Password configured, not logged in
{"setup_required": false, "authenticated": false}

// Password configured, logged in
{"setup_required": false, "authenticated": true}
| Field | Type | Notes |
|---|---|---|
setup_required | boolean | true when no admin password has been set. System is in open-access mode. |
authenticated | boolean | true when the request carries a valid session or API key, or when setup_required is true. |
API Key Management
API keys are prefixed with mm_ and are SHA-256 hashed before storage. The plaintext key is only returned once at creation time.
All key management endpoints require authentication.
POST /api/keys
Creates a new API key.
// Request
{"name": "ci-pipeline", "scope": "ReadOnly"}

// Response 201
{
  "key": "mm_abc123...",
  "key_hash": "a1b2c3...",
  "name": "ci-pipeline",
  "scope": "ReadOnly"
}
The key field is the only time the plaintext key is returned. Store it securely.
Scopes:
| Value | Access |
|---|---|
ReadOnly | Read-only access to stats queries. |
Admin | Full admin access (key management, config). |
GET /api/keys
Lists all API keys (without plaintext values).
[
  {
    "key_hash": "a1b2c3...",
    "name": "ci-pipeline",
    "scope": "ReadOnly",
    "created_at": "2024-01-15T10:00:00Z",
    "revoked": false
  }
]
DELETE /api/keys/{key_hash}
Revokes an API key by its SHA-256 hex hash.
// Response 200
{"status": "revoked"}

// Response 404 if hash not found
{"error": "Key not found"}
Using API Keys
API keys can be passed in two ways:
Authorization header (Bearer token):
curl "https://your-instance.com/api/stats/main?site_id=example.com&period=30d" \
  -H "Authorization: Bearer mm_abc123..."
X-API-Key header:
curl "https://your-instance.com/api/stats/main?site_id=example.com&period=30d" \
  -H "X-API-Key: mm_abc123..."
Both headers are accepted on all stats and admin endpoints. ReadOnly keys can access stats endpoints; all key management endpoints (GET /api/keys, POST /api/keys, DELETE /api/keys/{hash}) require an Admin-scoped key.
Health & Metrics Endpoints
These endpoints are publicly accessible (no authentication required) and are designed for monitoring and orchestration systems.
GET /health
Simple liveness check. Returns HTTP 200 when the server process is running.
HTTP/1.1 200 OK
Content-Type: text/plain

ok
Use this with your load balancer or container orchestrator liveness probe.
GET /health/ready
Readiness probe. Executes a lightweight DuckDB query to verify the database is operational.
Success (200):
HTTP/1.1 200 OK
Content-Type: text/plain

ready
Not ready (503):
HTTP/1.1 503 Service Unavailable
Content-Type: text/plain

database not ready
Use this as your Kubernetes readiness probe or Docker health check. Do not use it as a liveness probe — a 503 here means the database is temporarily unavailable, not that the process is dead.
GET /health/detailed
Detailed system status in JSON. Returns component-level health information.
{
  "status": "ok",
  "version": "0.1.0",
  "buffered_events": 42,
  "auth_configured": true,
  "geoip_loaded": false,
  "behavioral_extension_loaded": true,
  "filter_bots": true,
  "cache_entries": 3,
  "cache_empty": false
}
| Field | Type | Description |
|---|---|---|
status | string | Always "ok" when the server is running. |
version | string | Binary version from Cargo.toml. |
buffered_events | integer | Events in the in-memory buffer, not yet flushed to Parquet. |
auth_configured | boolean | Whether an admin password has been set. |
geoip_loaded | boolean | Whether a MaxMind GeoLite2 database was successfully loaded. |
behavioral_extension_loaded | boolean | Whether the DuckDB behavioral extension loaded successfully at startup. |
filter_bots | boolean | Whether bot filtering is active. |
cache_entries | integer | Number of cached query results currently in memory. |
cache_empty | boolean | true if the query cache is empty. |
GET /metrics
Prometheus-compatible metrics in text exposition format (text/plain; version=0.0.4).
If MALLARD_METRICS_TOKEN is set, this endpoint requires Authorization: Bearer <token>. Returns 401 Unauthorized without a valid token.
Gauges
# HELP mallard_buffered_events Number of events in the in-memory buffer
# TYPE mallard_buffered_events gauge
mallard_buffered_events 42

# HELP mallard_cache_entries Number of cached query results
# TYPE mallard_cache_entries gauge
mallard_cache_entries 3

# HELP mallard_auth_configured Whether admin password is set
# TYPE mallard_auth_configured gauge
mallard_auth_configured 1

# HELP mallard_geoip_loaded Whether GeoIP database is loaded
# TYPE mallard_geoip_loaded gauge
mallard_geoip_loaded 0

# HELP mallard_filter_bots Whether bot filtering is enabled
# TYPE mallard_filter_bots gauge
mallard_filter_bots 1

# HELP mallard_behavioral_extension Whether behavioral extension is loaded
# TYPE mallard_behavioral_extension gauge
mallard_behavioral_extension 1
Counters
# HELP mallard_events_ingested_total Total events ingested via POST /api/event
# TYPE mallard_events_ingested_total counter
mallard_events_ingested_total 158432

# HELP mallard_flush_failures_total Total buffer flush failures
# TYPE mallard_flush_failures_total counter
mallard_flush_failures_total 0

# HELP mallard_rate_limit_rejections_total Total requests rejected by per-site rate limiter
# TYPE mallard_rate_limit_rejections_total counter
mallard_rate_limit_rejections_total 17

# HELP mallard_login_failures_total Total failed login attempts
# TYPE mallard_login_failures_total counter
mallard_login_failures_total 3

# HELP mallard_cache_hits_total Total query cache hits
# TYPE mallard_cache_hits_total counter
mallard_cache_hits_total 9871

# HELP mallard_cache_misses_total Total query cache misses
# TYPE mallard_cache_misses_total counter
mallard_cache_misses_total 1204
Prometheus Scrape Configuration
scrape_configs:
  - job_name: mallard_metrics
    static_configs:
      - targets: ['localhost:8000']
    metrics_path: /metrics
    scrape_interval: 30s
    # If MALLARD_METRICS_TOKEN is set:
    authorization:
      credentials: your-metrics-bearer-token
Architecture
Overview
Mallard Metrics is a single Rust binary that handles the complete analytics lifecycle: event ingestion, storage, querying, authentication, and dashboard serving. There are no external services, no message queues, and no separate database process.
flowchart TD
    TS["Tracking Script\nmallard.js <1KB"]
    DASH["Dashboard SPA\nPreact + HTM"]

    TS -->|"POST /api/event"| AXUM
    DASH <-->|"GET /api/stats/*\nGET /api/keys/*"| AXUM

    subgraph BINARY["Single Binary — Single Process"]
        AXUM["Axum HTTP Server\nport 8000"]

        subgraph INGEST["Ingestion Pipeline"]
            direction LR
            OC["Origin Check\nRate Limiter"] --> BF["Bot Filter\nUA Parser"]
            BF --> GEO["GeoIP Lookup\nVisitor ID Hash"]
            GEO --> BUF["In-Memory\nEvent Buffer"]
        end

        subgraph STORE["Two-Tier Storage"]
            direction LR
            DB["DuckDB disk-based\nmallard.duckdb\nWAL durability"]
            PQ["Parquet Files\nsite_id=*/date=*/*.parquet\nZSTD-compressed"]
            VIEW["events_all VIEW\nhot union cold"]
            DB -->|"COPY TO"| PQ
            DB --> VIEW
            PQ -->|"read_parquet()"| VIEW
        end

        subgraph QUERY["Query Engine"]
            direction LR
            CACHE["TTL Query Cache"] --> QH["Stats\nSessions\nFunnels\nRetention\nSequences\nFlow"]
            EXT["behavioral extension\nsessionize\nwindow_funnel\nretention\nsequence_match"] -.->|"optional"| CACHE
        end

        AUTH["Auth Layer\nArgon2id passwords\n256-bit session tokens\nAPI keys SHA-256"] -.->|"guards"| AXUM

        AXUM --> OC
        BUF -->|"flush"| DB
        VIEW --> CACHE
        QH --> AXUM
    end
Event Ingestion Pipeline
Every POST /api/event request passes through a sequential pipeline of validation and enrichment steps before being buffered.
flowchart TD
    START(["POST /api/event\nJSON body"])

    START --> SZ{"Body size\n≤ 64 KB?"}
    SZ -->|"No"| R413["413 Request\nEntity Too Large"]
    SZ -->|"Yes"| OC

    OC{"Origin in\nallowlist?"}
    OC -->|"No (if configured)"| R403["403 Forbidden"]
    OC -->|"Yes"| RL

    RL{"Rate limit\nexceeded?"}
    RL -->|"Yes"| R429["429 Too Many Requests\nRetry-After header"]
    RL -->|"No"| SITEID

    SITEID{"site_id valid?\na-z A-Z 0-9 .-: max 256 chars"}
    SITEID -->|"No"| R400["400 Bad Request"]
    SITEID -->|"Yes"| BOT

    BOT{"Bot\nUser-Agent?"}
    BOT -->|"Yes"| DISCARD["Silently discarded\n202 Accepted"]
    BOT -->|"No"| UA

    UA["Parse User-Agent\nbrowser, OS, device type"]
    UA --> GEO

    GEO["GeoIP Lookup\ncountry, region, city\nGraceful fallback if no DB"]
    GEO --> VID

    VID["Compute Visitor ID\nHMAC-SHA256\nIP plus UA plus daily-salt\nDiscard IP immediately"]
    VID --> URL

    URL["Parse URL\npathname, hostname\nUTM parameters"]
    URL --> BUF

    BUF["Push to In-Memory Buffer"]
    BUF --> THR{"Buffer count\n>= flush_event_count?"}
    THR -->|"Yes"| FLUSH["Flush to DuckDB\nAppender API batch insert"]
    THR -->|"No"| R202
    FLUSH --> R202

    R202(["202 Accepted"])
Two-Tier Storage Model
Mallard Metrics stores events in two complementary tiers, always queried together via the events_all VIEW.
flowchart LR
    INGEST["Ingestion\nEvent Buffer"]

    subgraph HOT["Hot Tier — DuckDB (mallard.duckdb)"]
        EVENTS["events table\nrecently arrived events\nWAL-backed, survives SIGKILL"]
    end

    subgraph COLD["Cold Tier — Parquet on Disk"]
        P1["site_id=example.com/\ndate=2024-01-15/\n0001.parquet"]
        P2["site_id=example.com/\ndate=2024-01-16/\n0001.parquet"]
        P3["site_id=other.org/\ndate=2024-01-15/\n0001.parquet"]
    end

    subgraph UNIFIED["Unified Query Layer"]
        VIEW["events_all VIEW\nSELECT * FROM events\nUNION ALL\nSELECT * FROM read_parquet(...)"]
    end

    INGEST -->|"flush"| EVENTS
    EVENTS -->|"COPY TO ZSTD"| P1
    EVENTS -->|"COPY TO ZSTD"| P2
    EVENTS -->|"COPY TO ZSTD"| P3
    EVENTS -->|"hot events"| VIEW
    P1 -->|"read_parquet()"| VIEW
    P2 -->|"read_parquet()"| VIEW
    P3 -->|"read_parquet()"| VIEW
    VIEW --> ANALYTICS["Analytics Queries\nGET /api/stats/*"]
Hot tier (data/mallard.duckdb): Stores events that have been buffered but not yet flushed. Events here are immediately queryable. The DuckDB WAL provides durability — hot events survive a SIGKILL (crash), not just a graceful SIGTERM.
Cold tier (.parquet files): After flushing, events are written as ZSTD-compressed Parquet files partitioned by site and date. These files are the primary durability layer for historical data and can be queried independently with any Parquet-compatible tool (DuckDB CLI, pandas, Apache Spark).
The events_all VIEW is created at startup and refreshed after each flush. It transparently unions the hot and cold tiers so all analytics queries work correctly regardless of which tier the data resides in.
The cold-tier directory layout:
data/events/
├── site_id=example.com/
│   ├── date=2024-01-15/
│   │   ├── 0001.parquet
│   │   └── 0002.parquet
│   └── date=2024-01-16/
│       └── 0001.parquet
└── site_id=other-site.org/
    └── date=2024-01-15/
        └── 0001.parquet
Authentication Architecture
flowchart TD
    subgraph CREDS["Credentials at Rest"]
        HASH["Admin Password\nArgon2id hash PHC defaults\nmemory-only at runtime"]
        KEYS["API Keys\nmm_ prefix plus 256-bit random\nSHA-256 hash on disk\nJSON file in data_dir"]
        SESS["Session Tokens\n256-bit OS CSPRNG\nHashMap with TTL expiry\nHttpOnly SameSite=Strict"]
    end

    BROWSER["Browser"] -->|"POST /api/auth/login\npassword"| ARGON
    ARGON["Argon2id verify"] -->|"match"| SESS
    SESS -->|"session cookie\nHttpOnly Secure SameSite=Strict"| BROWSER

    APICLIENT["API Client"] -->|"Authorization: Bearer mm_xxx\nor X-API-Key: mm_xxx"| KEYCHECK
    KEYCHECK["SHA-256 hash\nconstant-time compare"] -->|"valid"| SCOPE

    SCOPE{"Scope check"}
    SCOPE -->|"ReadOnly key"| READONLY["GET /api/stats/*\nGET /api/keys/*"]
    SCOPE -->|"Admin key"| ADMIN["All routes\nincluding POST /api/keys\nDELETE /api/keys/*"]

    BROWSER -->|"GET /api/stats/*\nauto-sent cookie"| SESSMW
    SESSMW["Session middleware\nTTL check"] -->|"valid"| ROUTE

    ROUTE["Route Handler"]

    CSRF["CSRF check\nOrigin vs dashboard_origin"] -.->|"state-mutating\nroutes only"| ROUTE
    BF["Brute-force check\nper-IP attempt counting\nconfigurable lockout"] -.->|"login endpoint"| ARGON
Key Security Properties
| Property | Implementation |
|---|---|
| Password storage | Argon2id hash (PHC defaults), never stored in plaintext |
| Session tokens | 256-bit OS CSPRNG; HashMap with TTL; cleared on restart |
| API key storage | SHA-256 hash on disk; plaintext returned only at creation |
| Timing attacks | Constant-time comparison for API key validation |
| Session cookies | HttpOnly; Secure; SameSite=Strict |
| CSRF | Origin/Referer validation on all state-mutating session-auth routes |
| Brute force | Per-IP attempt counting; configurable lockout and Retry-After |
Behavioral Extension
Advanced analytics rely on the DuckDB behavioral extension, which provides window aggregate functions purpose-built for clickstream analysis.
flowchart LR
    subgraph EXT["behavioral extension"]
        SESS_F["sessionize()\nGroup events into sessions\nby visitor and time gap"]
        FUNNEL_F["window_funnel()\nMulti-step ordered\nconversion funnel"]
        RET_F["retention()\nWeekly cohort\nretention grid"]
        SEQ_F["sequence_match()\nBehavioral pattern\ndetection"]
        FLOW_F["sequence_next_node()\nNext-page\nflow analysis"]
    end

    subgraph API["Behavioral Endpoints"]
        direction TB
        S["/api/stats/sessions"]
        FU["/api/stats/funnel"]
        R["/api/stats/retention"]
        SQ["/api/stats/sequences"]
        FL["/api/stats/flow"]
    end

    SESS_F --> S
    FUNNEL_F --> FU
    RET_F --> R
    SEQ_F --> SQ
    FLOW_F --> FL

    CORE["Core analytics\n/api/stats/main\n/api/stats/timeseries\n/api/stats/breakdown/*"] -.->|"no extension\nrequired"| ALWAYS["Always available"]
The extension is loaded at startup:
INSTALL behavioral FROM community;
LOAD behavioral;
If loading fails (network unavailable, air-gapped environment), all extension-dependent endpoints return graceful defaults (zeroes or empty arrays). Core analytics continue working normally. The GET /health/detailed JSON response and GET /metrics Prometheus output both report whether the extension loaded successfully.
Module Map
| Module | Purpose |
|---|---|
config.rs | TOML + environment variable configuration |
server.rs | Axum router with CORS configuration and middleware stack |
ingest/handler.rs | POST /api/event ingestion handler |
ingest/buffer.rs | In-memory event buffer with periodic flush |
ingest/visitor_id.rs | HMAC-SHA256 privacy-safe visitor ID |
ingest/useragent.rs | User-Agent parsing |
ingest/geoip.rs | MaxMind GeoIP reader with graceful fallback |
ingest/ratelimit.rs | Per-site token-bucket rate limiter |
storage/schema.rs | DuckDB table definitions and events_all view |
storage/parquet.rs | Parquet write/read/partitioning |
storage/migrations.rs | Schema versioning |
query/metrics.rs | Core metric calculations |
query/breakdowns.rs | Dimension breakdown queries |
query/timeseries.rs | Time-bucketed aggregations |
query/sessions.rs | sessionize-based session queries |
query/funnel.rs | window_funnel query builder |
query/retention.rs | Retention cohort query execution |
query/sequences.rs | sequence_match query execution |
query/flow.rs | sequence_next_node flow analysis |
query/cache.rs | TTL-based query result cache |
api/stats.rs | All analytics API handlers |
api/errors.rs | API error types |
api/auth.rs | Origin validation, session auth, API key management |
dashboard/ | Embedded SPA (Preact + HTM) |
Security & Privacy
Privacy Model
Mallard Metrics is built with privacy as a hard constraint, not an afterthought.
No Cookies
The tracking script sets no cookies. There is no cookie-based session tracking of any kind.
No PII Storage
The client IP address is the only potentially identifying value that reaches the server. It is:
- Used to compute the visitor ID (see below).
- Used for a GeoIP lookup (if configured).
- Discarded immediately. It is never written to the database, log files, or Parquet files.
No names, email addresses, or device fingerprints are collected or stored.
Privacy-Safe Visitor ID
To count unique visitors without storing PII, Mallard Metrics uses a two-step HMAC-SHA256 derivation:
flowchart LR
    SECRET["MALLARD_SECRET\nenvironment variable"]
    DATE["Today UTC date\n2024-01-15"]

    SECRET --> H1["HMAC-SHA256\nkey = 'mallard-metrics-salt'\nmsg = SECRET + ':' + DATE"]
    DATE --> H1
    H1 --> SALT["daily_salt\nrotates every 24 h"]

    IP["Client IP address"]
    UA["User-Agent header"]

    IP --> H2["HMAC-SHA256\nkey = daily_salt\nmsg = IP + '|' + UA"]
    UA --> H2
    SALT --> H2
    H2 --> VID["visitor_id\nstored in database"]

    IP -->|"discarded\nimmediately after"| TRASH["not stored"]
Properties of this approach:
- Deterministic within a day — The same visitor from the same browser produces the same ID throughout the day, enabling accurate unique-visitor counts.
- Rotates daily — The UTC date rotates the effective key every 24 hours, so IDs cannot be correlated across days.
- Not reversible — Without
MALLARD_SECRET, the IP address cannot be recovered from the stored hash. - No IP storage — The IP address is discarded immediately after hashing.
GDPR/CCPA Compliance
Mallard Metrics stores pseudonymous visitor IDs (daily-rotating HMAC-SHA256 hashes), which are personal data under GDPR Recital 26. Operators must establish a lawful basis for processing — typically Art. 6(1)(f) legitimate interests for aggregate analytics, especially when combined with GDPR mode. See PRIVACY.md for the full legal analysis, DPIA guidance, and operator obligations.
Key points:
- No cookies are set for tracking — no ePrivacy consent banner is needed for the tracking script itself.
- Data subject erasure is supported via
DELETE /api/gdpr/erase(Admin API key required). - No third-party data sharing — all processing is first-party, no data processor agreements needed.
Authentication Security
Dashboard Password
Passwords are hashed with Argon2id using PHC default parameters before any comparison. The plaintext password is never stored. The hash is held in memory and loaded from the MALLARD_ADMIN_PASSWORD environment variable at startup.
Session Tokens
Dashboard sessions use 256-bit cryptographically random tokens generated with the OS CSPRNG. Tokens are delivered as HttpOnly; SameSite=Strict cookies to prevent JavaScript access and CSRF.
Sessions are stored in an in-memory HashMap with TTL expiry (default 24 hours, configurable via session_ttl_secs). Sessions are cleared on server restart.
When MALLARD_SECURE_COOKIES=true is set (required when behind a TLS reverse proxy), the Secure flag is added to the cookie, preventing transmission over plain HTTP.
API Keys
| Property | Value |
|---|---|
| Entropy | 256 bits of randomness |
| Prefix | mm_ — easy to identify in logs and secret scanners |
| Storage | SHA-256 hash stored in a JSON file in data_dir/. Plaintext returned only at creation. |
| Comparison | Constant-time equality to prevent timing side-channel attacks |
| Scopes | ReadOnly (GET stats only) or Admin (full access including key management) |
| Persistence | Disk-persisted; survive server restarts |
Input Validation and SQL Injection Prevention
Parameterized Queries
All user-supplied values (site IDs, date ranges, event names) are bound to SQL statements as parameters using DuckDB's prepared statement API. Raw string interpolation is used only where DuckDB's API does not support parameters (e.g., COPY TO file paths), and those values are explicitly validated and escaped before use.
Path Traversal Prevention
The site_id value is validated by is_safe_path_component() before being used in any filesystem path. The following are rejected:
- Empty strings
- Strings containing
..(directory traversal) - Strings containing
/or\(path separators) - Strings containing null bytes (
\0) - Strings longer than 256 characters
- Characters outside
[a-zA-Z0-9._\-:]
Funnel and Sequence Step Validation
User-supplied funnel and sequence steps (from ?steps= query parameters) are parsed from a safe page:/path or event:name format. Raw SQL expressions are never accepted from the API. Single quotes in path values are escaped by doubling.
Date Range Validation
The start_date and end_date parameters are validated as YYYY-MM-DD format, checked for logical consistency (end >= start), and capped at a maximum 366-day span.
Breakdown Limit
The limit parameter for breakdown queries is capped at 1000 to prevent unbounded result sets.
Origin Validation
When site_ids is configured, the Origin header is validated with exact host matching:
https://example.com→ passes (if"example.com"is insite_ids).http://example.com:8080→ passes (explicit port suffix allowed).https://example.com.evil.com→ rejected (prefix match is explicitly disallowed).
CSV Injection Prevention
The CSV export endpoint escapes fields starting with formula-triggering characters (=, +, -, @) by prefixing them with a single quote, preventing formula injection when the CSV is opened in spreadsheet software.
Brute-Force Protection
Login attempts are tracked per client IP address. After max_login_attempts consecutive failures (default 5), the IP is locked out for login_lockout_secs seconds (default 300). The server returns 429 Too Many Requests with a Retry-After header containing the remaining lockout duration.
A successful login clears the failure count for that IP. Failure counts are stored in memory and reset on server restart.
Configure via TOML fields max_login_attempts and login_lockout_secs, or the environment variables MALLARD_MAX_LOGIN_ATTEMPTS and MALLARD_LOGIN_LOCKOUT. Set max_login_attempts = 0 to disable.
Security Headers
All HTTP responses include these OWASP-recommended security headers:
| Header | Value | Purpose |
|---|---|---|
X-Content-Type-Options | nosniff | Prevents MIME-type sniffing |
X-Frame-Options | DENY | Prevents clickjacking via iframe embedding |
Referrer-Policy | strict-origin-when-cross-origin | Limits referrer leakage |
Content-Security-Policy | HTML responses only | Restricts scripts and resources to same origin |
Permissions-Policy | geolocation=(), microphone=(), camera=() | Disables browser feature APIs |
Strict-Transport-Security | max-age=31536000; includeSubDomains; preload | Instructs browsers to enforce HTTPS for 1 year; eligible for preload lists |
Cache-Control | no-store, no-cache | JSON API responses only; prevents analytics data caching |
X-Request-ID | UUID per request | Injected by the server, propagated through tracing spans for log correlation |
HTTP Timeout
All requests have a 30-second server-side timeout. Connections that do not complete within this window are closed with 408 Request Timeout. This prevents Slowloris-style attacks that hold connections open indefinitely.
CSRF Protection
State-mutating endpoints authenticated via session cookie (login, logout, setup, key creation, key revocation) validate the Origin or Referer header against the configured dashboard_origin. Requests with a mismatched or missing origin receive 403 Forbidden.
When dashboard_origin is not set, CSRF checks are bypassed (all origins allowed). Set dashboard_origin in production to enable CSRF protection.
Network Security
CORS Policy
Mallard Metrics uses separate CORS policies for ingestion and dashboard routes:
Ingestion (POST /api/event):
Access-Control-Allow-Origin: *
Access-Control-Allow-Methods: POST
Dashboard / Stats / Admin (when dashboard_origin is set):
Access-Control-Allow-Origin: <configured origin>
Access-Control-Allow-Methods: GET, POST, DELETE
Access-Control-Allow-Credentials: true
If dashboard_origin is not configured, the dashboard routes use a permissive policy that allows any origin (explicitly, not same-origin-only). Set dashboard_origin in production to restrict cross-origin access.
TLS
Mallard Metrics does not handle TLS directly. In production, place it behind a TLS-terminating reverse proxy (nginx, Caddy, Traefik, etc.). Set MALLARD_SECURE_COOKIES=true once the proxy is in place.
Request Concurrency
The four heavy behavioral analytics endpoints (/api/stats/funnel, /api/stats/retention, /api/stats/sequences, /api/stats/flow) are protected by a semaphore. The maximum number of concurrent heavy queries is configurable via MALLARD_MAX_CONCURRENT_QUERIES (default 10). Requests that exceed this limit receive 429 Too Many Requests with a Retry-After header.
Supply Chain
- All Rust dependencies are audited with
cargo-denyin CI. - GitHub Actions steps are pinned to exact commit SHAs (no floating version tags).
- The
bundledDuckDB feature compiles DuckDB from source as part of the build; no pre-built DuckDB binaries are downloaded at runtime. cargo build --lockedis used in CI to ensure reproducible builds fromCargo.lock.
Threat Model Summary
| Threat | Mitigation |
|---|---|
| SQL injection | Parameterized queries throughout; site_id character validation |
| Path traversal | is_safe_path_component() on all filesystem paths |
| CSRF | Origin/Referer validation on state-mutating session-auth routes |
| Brute force (login) | Per-IP lockout, Argon2id hashing |
| Brute force (API) | Per-site rate limiting |
| Session hijacking | HttpOnly; Secure; SameSite=Strict cookies |
| Timing attacks | Constant-time comparison for API keys |
| Clickjacking | X-Frame-Options: DENY |
| Protocol downgrade | Strict-Transport-Security (HSTS, 1 year) |
| MIME sniffing | X-Content-Type-Options: nosniff |
| Data exfiltration | No outbound network calls; embedded DB; IP discarded after hash |
| PII leakage | IPs hashed then discarded; daily ID rotation; no cookies |
| CSV injection | Formula character escaping in export output |
| Dependency vulnerabilities | cargo-deny in CI; Cargo.lock committed and enforced |
Behavioral Analytics
Mallard Metrics integrates the DuckDB behavioral extension to provide advanced analytics that go beyond simple counts. This extension proves that DuckDB behavioral analytics is not just an academic exercise — it can power real-world, production analytics with a homelab-friendly footprint.
Prerequisites
The behavioral extension is loaded at startup:
INSTALL behavioral FROM community;
LOAD behavioral;
If the extension cannot be loaded (e.g., network unavailable or air-gapped environment), all behavioral endpoints return graceful defaults (zeroes or empty arrays). Core analytics (visitors, pageviews, breakdowns, timeseries) are unaffected.
The GET /health/detailed JSON response includes "behavioral_extension_loaded": true/false, and GET /metrics exposes the mallard_behavioral_extension gauge (1 = loaded, 0 = unavailable).
Session Analytics
Endpoint: GET /api/stats/sessions
Uses sessionize(timestamp, INTERVAL '30 minutes') to group events into sessions per visitor. A new session begins when there is a gap of more than 30 minutes between events from the same visitor.
Metrics returned:
| Field | Description |
|---|---|
total_sessions | Total number of distinct sessions |
avg_session_duration_secs | Mean session duration in seconds |
avg_pages_per_session | Mean pageviews per session |
Funnel Analysis
Endpoint: GET /api/stats/funnel
Uses window_funnel(interval, timestamp, step1, step2, ...) to find visitors who completed a sequence of steps within a time window.
Example — Pricing to Signup funnel:
GET /api/stats/funnel?site_id=example.com&steps=page:/pricing,event:signup&window=1+day
Step format:
| Input | SQL condition |
|---|---|
page:/pricing | pathname = '/pricing' |
event:signup | event_name = 'signup' |
Response: Array of {step, visitors} showing how many visitors reached each step.
Notes:
- Steps must be ordered (each step must follow the previous in time).
- The
windowparameter controls the maximum elapsed time between the first and last step (e.g.,1 day,2 hours). - At least 1 step is required; 2+ steps produce a meaningful funnel chart.
Retention Cohorts
Endpoint: GET /api/stats/retention?weeks=N
Uses retention(condition1, condition2, ...) to compute weekly cohort retention. Each cohort is defined by a visitor's first-seen week. Subsequent weeks show whether they returned.
Example response (4-week retention):
[
  {"cohort_date": "2024-01-08", "retained": [true, true, false, true]},
  {"cohort_date": "2024-01-15", "retained": [true, false, true, false]}
]
Each boolean in retained corresponds to one week: retained[0] is always true (the cohort week itself), and subsequent values indicate whether the visitor was seen in weeks +1, +2, +3, etc.
| Parameter | Default | Range | Description |
|---|---|---|---|
weeks | 4 | 1–52 | Number of weeks to include in the cohort grid |
Sequence Matching
Endpoint: GET /api/stats/sequences
Uses sequence_match(pattern, timestamp, cond1, cond2, ...) to find visitors who performed a specific behavioral pattern. Returns overall conversion metrics.
Example — Pricing → Signup conversion:
GET /api/stats/sequences?site_id=example.com&steps=page:/pricing,event:signup
Response:
{
  "converting_visitors": 89,
  "total_visitors": 500,
  "conversion_rate": 0.178
}
Minimum 2 steps required. Steps use the same page:/path and event:name format as the funnel endpoint.
Flow Analysis
Endpoint: GET /api/stats/flow?page=/pricing
Uses sequence_next_node('forward', 'first_match', ...) to find the most common pages visitors navigate to after a given page.
Response:
[
  {"next_page": "/signup",  "visitors": 234},
  {"next_page": "/contact", "visitors": 89},
  {"next_page": "/",        "visitors": 67}
]
Returns up to 10 next-page destinations ordered by visitor count. Useful for understanding user navigation patterns and identifying high-exit pages.
Dashboard Views
The dashboard includes interactive views for all behavioral analytics:
- Sessions — Cards showing total sessions, average duration, and pages per session.
- Funnel — Horizontal bar chart with configurable steps and conversion percentages.
- Retention — Cohort grid table showing
Y(returned) /-(not returned) per week. - Sequences — Conversion metrics cards with converting visitors, total visitors, and rate.
- Flow — Next-page table with visitor counts.
Graceful Degradation
All behavioral endpoints degrade gracefully when the extension is not available:
| Endpoint | Without extension |
|---|---|
GET /api/stats/sessions | Returns zeros for all fields |
GET /api/stats/funnel | Returns empty array |
GET /api/stats/retention | Returns empty array |
GET /api/stats/sequences | Returns zeros for all fields |
GET /api/stats/flow | Returns empty array |
Core analytics (/api/stats/main, /api/stats/timeseries, /api/stats/breakdown/*) do not use the extension and are always available.
Deployment
Production Checklist
Before going to production:
-
Set
MALLARD_SECRETto a random 32+ character string and keep it constant across restarts. -
Set
MALLARD_ADMIN_PASSWORDto a strong password. -
Set
MALLARD_SECURE_COOKIES=truewhen behind a TLS-terminating reverse proxy so session cookies carry theSecureflag. -
Set
MALLARD_METRICS_TOKENto a secret token if the/metricsendpoint is publicly reachable. - Configure a TLS-terminating reverse proxy (nginx, Caddy, Traefik).
-
Mount a persistent volume for
data_dir(containsmallard.duckdband Parquet files). -
Set
site_idsto restrict event ingestion to your domains. -
Configure
retention_daysto match your data retention policy. -
Set
dashboard_originto your dashboard URL to enable CSRF protection. -
Use
/health/readyas your container or load-balancer readiness probe.
EU / GDPR deployments — additional steps:
-
Set
MALLARD_GDPR_MODE=true(or enable individual flags) to reduce data collection surface. -
Set
MALLARD_RETENTION_DAYS=30(or your DPA-approved retention period) for Art. 5(1)(e) storage limitation compliance. -
Set
MALLARD_GEOIP_PRECISION=country(already forced bygdpr_mode; document it explicitly in your DPIA). - Document your legal basis for processing in a DPIA or privacy notice. See PRIVACY.md for the full analysis.
-
Use
DELETE /api/gdpr/erase?site_id=...&start_date=...&end_date=...(Admin API key required) to honour Art. 17 erasure requests.
Docker (Recommended)
Pull and Run
docker run -d \
  --name mallard-metrics \
  --restart unless-stopped \
  -p 127.0.0.1:8000:8000 \
  -v mallard-data:/data \
  -e MALLARD_SECRET=your-random-32-char-secret \
  -e MALLARD_ADMIN_PASSWORD=your-dashboard-password \
  -e MALLARD_SECURE_COOKIES=true \
  -e MALLARD_METRICS_TOKEN=your-prometheus-token \
  ghcr.io/tomtom215/mallard-metrics
The image is built FROM scratch with a static musl binary. It has no shell, no package manager, and no runtime dependencies.
With a Config File
docker run -d \
  --name mallard-metrics \
  -v mallard-data:/data \
  -v /etc/mallard-metrics/config.toml:/config.toml:ro \
  -e MALLARD_SECRET=... \
  -e MALLARD_ADMIN_PASSWORD=... \
  ghcr.io/tomtom215/mallard-metrics /config.toml
Docker Compose
Save the following as docker-compose.yml:
services:
  mallard-metrics:
    image: ghcr.io/tomtom215/mallard-metrics:latest
    restart: unless-stopped
    ports:
      - "127.0.0.1:8000:8000"
    volumes:
      - mallard-data:/data
    environment:
      MALLARD_SECRET: "${MALLARD_SECRET}"
      MALLARD_ADMIN_PASSWORD: "${MALLARD_ADMIN_PASSWORD}"
      MALLARD_SECURE_COOKIES: "true"
      MALLARD_METRICS_TOKEN: "${MALLARD_METRICS_TOKEN}"
      MALLARD_LOG_FORMAT: "json"

volumes:
  mallard-data:
Create a .env file (do not commit to source control):
MALLARD_SECRET=your-random-32-char-secret
MALLARD_ADMIN_PASSWORD=your-dashboard-password
MALLARD_METRICS_TOKEN=your-prometheus-bearer-token
Start:
docker compose up -d
docker compose logs -f
Behind a Reverse Proxy
Mallard Metrics binds to 0.0.0.0:8000 by default (all interfaces). Set MALLARD_HOST=127.0.0.1 to restrict to localhost when behind a reverse proxy.
nginx
server {
    listen 443 ssl;
    server_name analytics.example.com;

    ssl_certificate     /etc/ssl/certs/analytics.example.com.crt;
    ssl_certificate_key /etc/ssl/private/analytics.example.com.key;

    location / {
        proxy_pass http://127.0.0.1:8000;
        proxy_set_header Host $host;
        proxy_set_header X-Forwarded-For $proxy_add_x_forwarded_for;
        proxy_set_header X-Real-IP $remote_addr;
    }
}
Important: Mallard Metrics reads the client IP for visitor ID hashing. If behind a proxy, the
X-Forwarded-FororX-Real-IPheader must be set correctly. Configure your proxy to send the real client IP.
Caddy
analytics.example.com {
    reverse_proxy 127.0.0.1:8000
}
Caddy sets X-Forwarded-For automatically.
After-Proxy Configuration
Once behind a TLS reverse proxy, set these environment variables:
# Enables Secure flag on session cookies
MALLARD_SECURE_COOKIES=true

# Restricts dashboard CORS and enables CSRF protection
MALLARD_DASHBOARD_ORIGIN=https://analytics.example.com
Health and Readiness Probes
| Endpoint | Purpose |
|---|---|
GET /health | Liveness probe — returns ok if the process is alive |
GET /health/ready | Readiness probe — queries DuckDB; returns 503 if the database is not ready |
GET /health/detailed | JSON health report — version, buffer, auth, GeoIP, behavioral extension, cache status |
Kubernetes Example
livenessProbe:
  httpGet:
    path: /health
    port: 8000
  initialDelaySeconds: 5
  periodSeconds: 10

readinessProbe:
  httpGet:
    path: /health/ready
    port: 8000
  initialDelaySeconds: 10
  periodSeconds: 15
  failureThreshold: 3
Docker Compose Health Check
The FROM scratch image has no shell or utilities (wget, curl). Use Docker's HEALTHCHECK with an external check from the host, or rely on your reverse proxy or orchestrator's health probes:
# External health check from the host
curl -sf http://localhost:8000/health/ready || exit 1
Build from Source (Static musl Binary)
To build a FROM scratch-compatible static binary:
# Install the musl target
rustup target add x86_64-unknown-linux-musl

# Build
cargo build --release --target x86_64-unknown-linux-musl

# The binary
ls -lh target/x86_64-unknown-linux-musl/release/mallard-metrics
The resulting binary has no dynamic library dependencies:
ldd target/x86_64-unknown-linux-musl/release/mallard-metrics
# not a dynamic executable
GeoIP Setup
Mallard Metrics supports optional IP geolocation via MaxMind GeoLite2.
- Create a free account at maxmind.com.
- Download the
GeoLite2-City.mmdbdatabase. - Configure the path:
# config.toml
geoip_db_path = "/data/GeoLite2-City.mmdb"
Or with Docker:
docker run ... \
  -v /path/to/GeoLite2-City.mmdb:/data/GeoLite2-City.mmdb:ro \
  -e ... \
  ghcr.io/tomtom215/mallard-metrics
If the file is missing or unreadable, country/region/city fields are stored as NULL. No error is raised.
Note: The MaxMind GeoLite2 database is updated monthly. Automate downloads with geoipupdate.
GDPR-Friendly Deployment
Mallard Metrics provides a configurable privacy mode designed to reduce the data-collection surface to a level that makes aggregate analytics possible under GDPR Art. 6(1)(f) legitimate interests (no consent required) for many EU operators. Consult your legal team; requirements vary by context and member-state law.
Activate GDPR Mode
The quickest path is the MALLARD_GDPR_MODE=true preset, which bundles the recommended privacy settings:
docker run -d \
  --name mallard-metrics \
  --restart unless-stopped \
  -p 127.0.0.1:8000:8000 \
  -v mallard-data:/data \
  -e MALLARD_SECRET=your-random-32-char-secret \
  -e MALLARD_ADMIN_PASSWORD=your-dashboard-password \
  -e MALLARD_SECURE_COOKIES=true \
  -e MALLARD_GDPR_MODE=true \
  -e MALLARD_RETENTION_DAYS=30 \
  ghcr.io/tomtom215/mallard-metrics
Or via TOML config:
gdpr_mode      = true
retention_days = 30
What GDPR Mode Does
| Flag | Standard | GDPR Mode |
|---|---|---|
| Referrer stored as | Full URL (with query/fragment) | Path only — ?q=... and #... stripped |
| Timestamps | Millisecond precision | Rounded to nearest hour |
| Browser info | Name + version | Name only (e.g. "Chrome") |
| OS info | Name + version | Name only (e.g. "Windows") |
| Screen / device | Stored | Omitted |
| GeoIP | City-level | Country-level only |
Fine-Grained Privacy Flags
Each setting can be controlled independently via environment variable or TOML key:
| Env var | TOML key | Default | Effect |
|---|---|---|---|
MALLARD_GDPR_MODE | gdpr_mode | false | Enable all flags below (except suppress_visitor_id) |
MALLARD_STRIP_REFERRER_QUERY | strip_referrer_query | false | Strip ?query and #fragment from referrers |
MALLARD_ROUND_TIMESTAMPS | round_timestamps | false | Round timestamps to nearest hour |
MALLARD_SUPPRESS_BROWSER_VERSION | suppress_browser_version | false | Store browser name only |
MALLARD_SUPPRESS_OS_VERSION | suppress_os_version | false | Store OS name only |
MALLARD_SUPPRESS_SCREEN_SIZE | suppress_screen_size | false | Omit screen size and device type |
MALLARD_GEOIP_PRECISION | geoip_precision | "city" | "city" / "region" / "country" / "none" |
MALLARD_SUPPRESS_VISITOR_ID | suppress_visitor_id | false | Replace HMAC hash with random UUID per request (breaks unique-visitor counting) |
Note on
suppress_visitor_id: This flag is intentionally not activated bygdpr_modebecause it eliminates unique-visitor metrics entirely. The default HMAC-SHA256 visitor ID is pseudonymous personal data under GDPR Recital 26. Most operators can rely on Art. 6(1)(f) legitimate interests for aggregate analytics without suppressing visitor IDs.
Right to Erasure (Art. 17)
Mallard Metrics supports data erasure requests via an authenticated API endpoint:
# Requires an Admin API key
curl -X DELETE \
  "https://analytics.example.com/api/gdpr/erase?site_id=mysite.com&start_date=2024-01-01&end_date=2024-12-31" \
  -H "X-API-Key: mm_your_admin_key"
Response:
{
  "site_id": "mysite.com",
  "start_date": "2024-01-01",
  "end_date": "2024-12-31",
  "db_records_deleted": 1423,
  "parquet_partitions_deleted": 8
}
Important limitations:
- Erasure is by site and date range, not by individual visitor ID (visitor IDs are pseudonymous hashes and cannot be reverse-mapped to individuals).
- After erasure, the
events_allVIEW is refreshed automatically. - Consider setting
MALLARD_RETENTION_DAYS=30for automated data minimisation under Art. 5(1)(e) in place of manual erasure requests.
Graceful Shutdown
Mallard Metrics handles SIGINT (Ctrl+C) and SIGTERM (Docker stop, systemd stop). On receiving either signal:
- The server stops accepting new connections.
- In-flight requests are completed.
- Buffered events are flushed to DuckDB (persisted via WAL).
The flush is bounded by shutdown_timeout_secs (default 30). If flushing takes longer, a warning is logged and the process exits.
Systemd Service
For non-Docker deployments:
[Unit]
Description=Mallard Metrics
After=network.target

[Service]
Type=simple
User=mallard
ExecStart=/usr/local/bin/mallard-metrics /etc/mallard-metrics/config.toml
Restart=on-failure
RestartSec=5s
Environment=MALLARD_SECRET=...
Environment=MALLARD_ADMIN_PASSWORD=...

[Install]
WantedBy=multi-user.target
systemctl daemon-reload
systemctl enable --now mallard-metrics
VPS Deployment Guide
Zero to production in one command — deploy Mallard Metrics on any generic Linux VPS with full TLS, LUKS-encrypted data at rest, Cloudflare DNS, and an automated security audit.
Overview
This guide deploys Mallard Metrics on a bare VPS using:
| Component | Role |
|---|---|
| Caddy (custom build) | TLS termination, reverse proxy, HTTP/3, ACME DNS-01 |
| Cloudflare DNS | DNS-01 ACME challenge — no port 80 required |
| LUKS | Full encryption of the analytics data volume at rest |
| Docker Compose | Container orchestration |
| vps-audit | Automated security assessment and weekly re-audit |
| UFW + fail2ban | Host-level firewall and brute-force protection |
The FROM scratch Mallard binary runs with no shell, no OS utilities, read-only root filesystem, all Linux capabilities dropped, and no network port exposed to the host — all traffic flows through Caddy on the internal Docker network.
Architecture
Internet
    │
    ▼
┌───────────────────────────────────────────────┐
│  VPS Host (Ubuntu/Debian)                     │
│                                               │
│  UFW Firewall: 22, 80, 443 (tcp+udp/QUIC)    │
│                                               │
│  ┌─────────────────────────────────────────┐  │
│  │  Docker network: mallard-production_proxy│  │
│  │                                         │  │
│  │  ┌─────────────┐    ┌───────────────┐   │  │
│  │  │   Caddy     │───▶│ mallard:8000  │   │  │
│  │  │ :80/:443    │    │ (FROM scratch) │   │  │
│  │  │ TLS + proxy │    │               │   │  │
│  │  └─────────────┘    └───────┬───────┘   │  │
│  └───────────────────────────  │ ──────────┘  │
│                                │              │
│  ┌─────────────────────────────▼────────────┐ │
│  │  LUKS encrypted volume (/srv/mallard/data)│ │
│  │  mallard.duckdb  data/YYYY/MM/DD/*.parquet│ │
│  └───────────────────────────────────────────┘ │
└───────────────────────────────────────────────┘
Prerequisites
VPS requirements
| Resource | Minimum | Recommended |
|---|---|---|
| CPU | 1 vCPU | 2 vCPU |
| RAM | 512 MB | 1 GB |
| Disk | 10 GB | 40 GB |
| OS | Ubuntu 22.04 | Ubuntu 24.04 LTS |
| Architecture | x86-64 | x86-64 |
Mallard Metrics is a single static binary. Under light to medium traffic (< 50k daily events) the minimum spec is adequate. The disk budget is dominated by Parquet data growth and the LUKS image pre-allocation.
Domain and DNS
You need a domain whose DNS is managed in Cloudflare. The domain can be:
- A subdomain:
analytics.example.com(recommended — keeps the apex clean) - An apex domain:
example.com
Create an A record pointing to your VPS IP before running setup. Caddy validates DNS during certificate issuance.
analytics.example.com. A 203.0.113.42
If you're using Cloudflare's proxy (orange cloud), set it to DNS only (grey cloud) for the analytics subdomain. Caddy manages TLS itself and Cloudflare's proxy can interfere with HTTP/3 and certificate validation.
Cloudflare API token
Caddy uses the Cloudflare API to create DNS TXT records for ACME DNS-01 challenges. Create a scoped token:
- Log in to dash.cloudflare.com → My Profile → API Tokens
- Click Create Token → Custom Token
- Set permissions:
- Zone → Zone → Read (for all zones or just the specific zone)
- Zone → DNS → Edit (for the specific zone containing your domain)
- Restrict to Zone Resources → Specific zone → your zone
- Copy the generated token — you will not see it again
SSH key access
setup.sh disables SSH password authentication as part of hardening. You must have an SSH public key installed on the server before running the script, or you will be locked out.
# On your local machine — copy your public key to the server
ssh-copy-id -i ~/.ssh/id_ed25519.pub user@your-vps-ip

# Verify it works before running setup
ssh -i ~/.ssh/id_ed25519 user@your-vps-ip echo "Key access confirmed"
One-Command Deployment
If you trust the script (review it first), this does everything:
# 1. SSH into the VPS
ssh user@your-vps-ip

# 2. Clone the repository
git clone https://github.com/tomtom215/mallardmetrics.git
cd mallardmetrics

# 3. Run the setup script
sudo bash deploy/setup.sh
The script is interactive — it will prompt for your domain, email, and Cloudflare API token, then generate and display the admin password.
Pre-set values to run non-interactively (e.g., for CI/cloud-init):
export MM_DOMAIN=analytics.example.com
export MM_EMAIL=admin@example.com
export MM_CF_TOKEN=your-cloudflare-token
sudo -E bash deploy/setup.sh
Step-by-Step Manual Deployment
Step 1 — Provision the VPS
Choose a provider (any KVM/XEN VPS works):
- Hetzner — CX22 (2 vCPU, 4 GB, €4/mo) is excellent value
- DigitalOcean — Basic Droplet $6/mo
- Vultr — Cloud Compute $5/mo
- Oracle Cloud Always Free — 2 AMD VMs, 200 GB block storage, genuinely free
- Linode/Akamai — Shared CPU $5/mo
Use Ubuntu 22.04 LTS or 24.04 LTS as the OS image. Enable backups at the provider level for an additional safety net.
After provisioning:
# Note your VPS IP address, then SSH in
ssh root@<VPS-IP>

# Immediately create a non-root user with sudo
adduser deploy
usermod -aG sudo deploy

# Add your SSH key to the new user
mkdir -p /home/deploy/.ssh
cp /root/.ssh/authorized_keys /home/deploy/.ssh/
chown -R deploy:deploy /home/deploy/.ssh
chmod 700 /home/deploy/.ssh
chmod 600 /home/deploy/.ssh/authorized_keys

# Switch to the non-root user for the rest
su - deploy
Step 2 — Clone the repository
git clone https://github.com/tomtom215/mallardmetrics.git
cd mallardmetrics
Step 3 — Run setup.sh
sudo bash deploy/setup.sh
The script will:
- Detect your OS and verify prerequisites
- Ask you to confirm SSH key access before hardening SSH
- Update packages and install tooling
- Harden SSH, enable UFW firewall, configure fail2ban
- Apply kernel hardening sysctl settings
- Install Docker CE and the Compose plugin
- Create a 20 GB LUKS-encrypted image at
/srv/mallard/data.imgand mount it - Download and run vps-audit — saving the report
- Prompt you to configure
deploy/.env(or auto-generate secrets) - Build the Docker images and start the stack
- Install weekly vps-audit and daily backup cron jobs
- Print your admin password and a post-setup checklist
Step 4 — Verify deployment
# Check container status
docker compose -f deploy/docker-compose.production.yml ps

# Check Caddy got a certificate (look for "TLS certificate obtained")
docker compose -f deploy/docker-compose.production.yml logs caddy | grep -i cert

# Test the health endpoint (replace with your domain)
curl -s https://analytics.example.com/health/ready

# Expected: ready
Open https://<your-domain> in a browser. You should see the Mallard Metrics dashboard login page.
What setup.sh Does
Here is the complete sequence of operations setup.sh performs, with the rationale for each:
| Step | Operation | Why |
|---|---|---|
| 1 | OS detection and SSH key check | Prevents lockout before hardening |
| 2 | apt upgrade + unattended-upgrades | Patches known CVEs immediately |
| 3 | SSH drop-in config in sshd_config.d/ | Non-destructive; preserves original config |
| 4 | UFW: deny-all ingress, allow 22/80/443 | Minimal attack surface |
| 5 | fail2ban for SSH | Blocks brute-force login attempts |
| 6 | Kernel sysctl hardening | Disables TCP redirects, restricts dmesg/BPF |
| 7 | Docker CE from official repo | Ensures a current, vendor-supported version |
| 8 | LUKS encrypted image + keyfile | Analytics data encrypted at rest |
| 9 | vps-audit + weekly cron | Ongoing visibility into security posture |
| 10 | Secret generation + deploy/.env | Strong random credentials without manual work |
| 11 | docker compose build && up -d | Brings the stack live |
| 12 | Backup cron (rsync) | Daily snapshot of DuckDB + Parquet |
LUKS Encrypted Volume
How it works
setup.sh creates a file-backed LUKS2 container at /srv/mallard/data.img using AES-XTS-PLAIN64 with a 512-bit key. A random keyfile is stored at /etc/mallard-data.key (read-only by root) so the volume auto-unlocks on boot without a passphrase prompt.
The decrypted volume is formatted ext4 and mounted at /srv/mallard/data. The Mallard Metrics container bind-mounts this path as /data.
/srv/mallard/data.img   ← LUKS2 container (AES-256 XTS, file on host disk)
        ↓ cryptsetup luksOpen
/dev/mapper/mallard-data  ← Decrypted block device
        ↓ ext4 mount
/srv/mallard/data/        ← Plaintext filesystem (only visible to root while mounted)
        ↓ Docker bind mount
/data/ (inside container) ← mallard.duckdb, data/YYYY/MM/DD/*.parquet
If an attacker gains access to the raw disk image (e.g., by stealing a disk or snapshot), the data is unreadable without the keyfile.
After reboot
The LUKS volume is configured in /etc/crypttab and /etc/fstab to auto-mount on boot using the keyfile. No manual intervention is required after a planned reboot.
# To verify the volume mounted after a reboot:
mountpoint /srv/mallard/data && echo "mounted" || echo "NOT mounted"

# If it did not mount (e.g., keyfile missing), mount manually:
sudo cryptsetup luksOpen --key-file /etc/mallard-data.key \
    /srv/mallard/data.img mallard-data
sudo mount /dev/mapper/mallard-data /srv/mallard/data

# Then restart the stack
sudo docker compose -f /path/to/mallardmetrics/deploy/docker-compose.production.yml up -d
Resizing the volume
# 1. Stop the stack
docker compose -f deploy/docker-compose.production.yml down

# 2. Unmount and close
sudo umount /srv/mallard/data
sudo cryptsetup luksClose mallard-data

# 3. Grow the image file (+10 GB example)
sudo fallocate -l 30G /srv/mallard/data.img          # change to new total size

# 4. Grow the LUKS container
sudo cryptsetup luksOpen --key-file /etc/mallard-data.key \
    /srv/mallard/data.img mallard-data
sudo cryptsetup resize mallard-data

# 5. Grow the filesystem
sudo e2fsck -f /dev/mapper/mallard-data
sudo resize2fs /dev/mapper/mallard-data

# 6. Re-mount and restart
sudo mount /dev/mapper/mallard-data /srv/mallard/data
docker compose -f deploy/docker-compose.production.yml up -d
Caddy and TLS
Cloudflare DNS challenge
The Caddyfile is configured for the ACME DNS-01 challenge using the Cloudflare provider. This means:
- Port 80 does not need to be accessible — challenge is completed via DNS API
- Wildcard certificates (
*.example.com) are supported - Certificates are obtained before the first request arrives
Caddy stores its ACME account and certificates in the caddy-data Docker volume. Certificates are renewed automatically, typically 30 days before expiry.
Certificate renewal
No action is required — Caddy handles renewal entirely. To check certificate status:
# View Caddy's certificate store
docker exec mallard-caddy caddy environ
docker exec mallard-caddy caddy list-modules | grep dns

# Check cert expiry
echo | openssl s_client -connect analytics.example.com:443 -servername analytics.example.com 2>/dev/null \
    | openssl x509 -noout -dates
Custom domain configurations
Subdomain (most common):
# In .env
DOMAIN=analytics.example.com
Apex domain:
# In .env
DOMAIN=example.com
Multiple domains (edit deploy/Caddyfile directly):
analytics.example.com, stats.myothersite.io {
    import security_headers
    reverse_proxy mallard:8000 { ... }
}
Security Hardening
vps-audit integration
vps-audit performs 40+ security checks across SSH, firewall, kernel, authentication, file permissions, and services.
# Run a fresh audit at any time
sudo vps-audit

# Run with JSON output for automation
sudo vps-audit --format json > /tmp/audit.json

# View the initial audit report
cat /srv/mallard/vps-audit-initial-$(date +%Y%m%d).log

# View weekly audit logs
tail -100 /var/log/vps-audit.log
The weekly cron runs every Sunday at 03:00 UTC. Review WARN and FAIL items and address them using the audit's built-in guidance (vps-audit --guide).
SSH hardening
setup.sh installs a hardening drop-in at /etc/ssh/sshd_config.d/99-mallard-hardening.conf:
PermitRootLogin no           # Root cannot SSH in at all
PasswordAuthentication no    # Only public key authentication
MaxAuthTries 3               # Lock after 3 failed attempts
LoginGraceTime 30            # 30s window to authenticate
ClientAliveInterval 300      # 5-minute keepalive
AllowAgentForwarding no      # No agent forwarding
AllowTcpForwarding no        # No tunnel forwarding
X11Forwarding no             # No graphical forwarding
fail2ban bans IPs after 5 failed SSH attempts for 1 hour.
Firewall (UFW)
# View current rules
sudo ufw status numbered

# Default policy after setup.sh
# Default incoming: deny
# Default outgoing: allow
# 22/tcp  — SSH
# 80/tcp  — HTTP (Caddy redirects to HTTPS)
# 443/tcp — HTTPS
# 443/udp — HTTP/3 QUIC
Kernel parameters
Applied via /etc/sysctl.d/99-mallard-hardening.conf:
| Setting | Value | Effect |
|---|---|---|
tcp_syncookies | 1 | SYN flood protection |
rp_filter | 1 | Spoofed packet rejection |
accept_redirects | 0 | ICMP redirect attacks blocked |
dmesg_restrict | 1 | Kernel log visible only to root |
unprivileged_bpf_disabled | 1 | BPF restricted to privileged users |
bpf_jit_harden | 2 | JIT hardening against side-channel |
suid_dumpable | 0 | No core dumps from setuid programs |
Configuration Reference
All configuration is in deploy/.env. The file is created by setup.sh from deploy/.env.example. Here are the settings most commonly adjusted post-deployment:
| Variable | Default | Description |
|---|---|---|
DOMAIN | (required) | Hostname Caddy serves |
MALLARD_RETENTION_DAYS | 365 | Delete Parquet partitions older than N days |
MALLARD_RATE_LIMIT | 0 (unlimited) | Max events/sec per site_id |
MALLARD_CACHE_TTL | 60 | Query result cache TTL (seconds) |
MALLARD_MAX_CONCURRENT_QUERIES | 10 | DuckDB concurrency cap |
MALLARD_MAX_LOGIN_ATTEMPTS | 5 | Failed logins before IP lockout |
MALLARD_LOGIN_LOCKOUT | 300 | Lockout duration (seconds) |
MALLARD_GEOIP_DB | (blank) | Path to MaxMind GeoLite2-City.mmdb (inside container) |
After editing .env, restart the stack:
docker compose -f deploy/docker-compose.production.yml up -d
Adding the Tracking Script
Add this to every page you want to track:
<script
  defer
  src="https://analytics.example.com/mallard.js"
  data-domain="example.com">
</script>
Replace analytics.example.com with your deployment domain and example.com with the site_id you want to use for this site.
Custom events:
window.mallard('Purchase', {
  revenue: 49.99,
  currency: 'USD',
  props: { plan: 'pro' }
});
Embed on GitHub Pages docs (static site):
Simply paste the <script> tag into your mdBook layout template or into individual markdown pages using HTML passthrough. The script is < 1 KB and has zero external dependencies.
Accessing the Dashboard Remotely
The dashboard is served at the root URL of your Mallard Metrics instance (e.g. https://analytics.example.com). It requires authentication when MALLARD_ADMIN_PASSWORD is set.
Note: The server sets
X-Frame-Options: DENYto prevent clickjacking, so the dashboard cannot be embedded in an iframe. Access it directly in a browser tab instead.
Post-Deployment Operations
View logs
# All services (follow)
docker compose -f deploy/docker-compose.production.yml logs -f

# Mallard only (JSON structured logs)
docker compose -f deploy/docker-compose.production.yml logs mallard | jq .

# Caddy access log (on the LUKS volume)
tail -f /srv/mallard/data/logs/caddy-access.log | jq .
Update Mallard Metrics
cd ~/mallardmetrics

# Pull latest changes
git pull origin main

# Rebuild and restart (zero downtime if only Mallard changes)
docker compose -f deploy/docker-compose.production.yml build mallard
docker compose -f deploy/docker-compose.production.yml up -d mallard

# Or rebuild everything
docker compose -f deploy/docker-compose.production.yml build --no-cache
docker compose -f deploy/docker-compose.production.yml up -d
The Caddy build only needs to be rebuilt if you change
deploy/Dockerfile.caddyordeploy/Caddyfile.
Backup and restore
Backup (done automatically daily by the cron job):
# Manual backup
rsync -a --delete /srv/mallard/data/ /srv/mallard/backup/

# Copy off-server (replace with your backup destination)
rsync -az /srv/mallard/data/ backup-server:/backups/mallard/$(date +%Y%m%d)/
Restore:
# Stop the stack
docker compose -f deploy/docker-compose.production.yml down

# Restore data files
rsync -a /srv/mallard/backup/ /srv/mallard/data/

# Restart
docker compose -f deploy/docker-compose.production.yml up -d
GeoIP setup
Mallard supports MaxMind GeoLite2-City for country/region/city resolution.
- Create a free MaxMind account at maxmind.com
- Download
GeoLite2-City.mmdb - Copy it to the data volume:
cp GeoLite2-City.mmdb /srv/mallard/data/GeoLite2-City.mmdb - Update
deploy/.env:MALLARD_GEOIP_DB=/data/GeoLite2-City.mmdb - Restart Mallard:
docker compose -f deploy/docker-compose.production.yml restart mallard
Set up weekly automatic updates (MaxMind databases are updated Tuesdays and Fridays):
# Install geoipupdate
apt-get install -y geoipupdate

# Configure with your MaxMind account ID and licence key
# /etc/GeoIP.conf:
# AccountID YOUR_ACCOUNT_ID
# LicenseKey YOUR_LICENSE_KEY
# EditionIDs GeoLite2-City

# Run update
geoipupdate

# Link to the data volume
ln -sf /usr/share/GeoIP/GeoLite2-City.mmdb /srv/mallard/data/GeoLite2-City.mmdb
Monitoring
The detailed health endpoint returns rich status JSON:
curl -s https://analytics.example.com/health/detailed | jq .
Example response:
{
  "status": "ok",
  "version": "0.1.0",
  "buffered_events": 0,
  "auth_configured": true,
  "geoip_loaded": false,
  "behavioral_extension_loaded": true,
  "filter_bots": true,
  "cache_entries": 0,
  "cache_empty": true
}
Prometheus metrics (requires MALLARD_METRICS_TOKEN):
curl -H "Authorization: Bearer $MALLARD_METRICS_TOKEN" \
  https://analytics.example.com/metrics
Available metrics:
mallard_events_ingested_total— cumulative event countmallard_flush_failures_total— Parquet flush failuresmallard_rate_limit_rejections_total— rate-limited requestsmallard_login_failures_total— failed dashboard loginsmallard_cache_hits_total/mallard_cache_misses_total— query cachemallard_behavioral_extension— 1 if the behavioral extension loaded
UptimeRobot / Better Uptime:
Monitor https://<domain>/health/ready with a 1-minute interval. It returns HTTP 200 when the database is reachable, 503 otherwise.
Troubleshooting
Caddy shows "certificate error" or HTTP instead of HTTPS
# Check Caddy logs for ACME errors
docker compose -f deploy/docker-compose.production.yml logs caddy | grep -i "acme\|cert\|error"

# Common causes:
# 1. CLOUDFLARE_API_TOKEN is wrong or lacks Zone:DNS:Edit permission
# 2. DNS A record not yet propagated (allow up to 10 minutes)
# 3. You hit Let's Encrypt rate limits — wait 1 hour or switch to staging
#    (uncomment the acme_ca staging line in deploy/Caddyfile)
Mallard container exits immediately
docker compose -f deploy/docker-compose.production.yml logs mallard

# Common cause: MALLARD_SECRET is blank (required at startup)
# Check deploy/.env has MALLARD_SECRET set to a non-empty value
Data volume not mounted after reboot
# Check if LUKS device is open
ls -la /dev/mapper/mallard-data || echo "LUKS device not open"

# Check mount
mountpoint /srv/mallard/data || echo "Not mounted"

# Manually open and mount
sudo cryptsetup luksOpen --key-file /etc/mallard-data.key \
    /srv/mallard/data.img mallard-data
sudo mount /dev/mapper/mallard-data /srv/mallard/data

# Restart stack
docker compose -f deploy/docker-compose.production.yml up -d
Health check returns 503
# Mallard is running but the DuckDB VIEW rebuild failed
docker compose -f deploy/docker-compose.production.yml logs mallard | tail -50

# Try restarting Mallard only (Caddy stays up, no TLS interruption)
docker compose -f deploy/docker-compose.production.yml restart mallard
Port 443 already in use
sudo ss -tlnp | grep :443
# If another process (nginx, apache) is listening:
sudo systemctl stop nginx apache2 2>/dev/null || true
docker compose -f deploy/docker-compose.production.yml up -d caddy
Out of disk space
df -h /srv/mallard/data   # Check LUKS volume usage
df -h /var/lib/docker     # Check Docker overlay usage

# Trim old Docker layers
docker system prune -f

# Enable data retention if not already set
# In deploy/.env: MALLARD_RETENTION_DAYS=365
# Then restart mallard
Frequently Asked Questions
Q: Can I deploy without Cloudflare?
Yes — use any DNS provider that Caddy supports. The DNS-01 plugin ecosystem includes Route53, GoDaddy, Namecheap, Gandi, and many others. See caddyserver.com/docs/modules/dns for the full list. Alternatively, if port 80 is accessible from the internet, change the Caddyfile global block to remove acme_dns and Caddy will use the HTTP-01 challenge automatically.
Q: Can I run Mallard Metrics on a Raspberry Pi or ARM server?
The current Dockerfile targets x86_64-unknown-linux-musl. To build for ARM64, change the target to aarch64-unknown-linux-musl in the Dockerfile and add platform: linux/arm64 to the compose service. The rest of the stack (Caddy, LUKS) is architecture-agnostic.
Q: How do I add multiple sites?
Mallard Metrics handles multiple sites with a single deployment. Each site uses a different data-domain in the tracking script. All data is partitioned by site_id at the Parquet layer. Dashboard queries are filtered per site.
Q: Is the LUKS keyfile approach secure?
The keyfile provides encryption at rest — protection against an attacker who obtains the raw disk image (e.g., a stolen drive or a cloud snapshot). It does not protect against an attacker who has live root access to a running server, because the decrypted volume is mounted and readable. For higher threat models, use a passphrase-protected LUKS setup with manual unlock after reboot, or consider a dedicated HSM.
Q: How do I change the admin password?
# Set the new password in deploy/.env
sed -i 's/^MALLARD_ADMIN_PASSWORD=.*/MALLARD_ADMIN_PASSWORD=new-password-here/' deploy/.env

# Restart mallard to pick it up
docker compose -f deploy/docker-compose.production.yml restart mallard
Q: Can I use a wildcard certificate?
Yes. DNS-01 challenge (which this setup uses) supports wildcards. Change your domain to *.example.com in the Caddyfile and the certificate will cover all subdomains.
Q: How do I run Mallard Metrics on a private/internal network with no public IP?
Since we use the DNS-01 challenge, the server does not need to be reachable on port 80 from the internet. Any server that can make outbound HTTPS requests to Cloudflare's API can get a certificate — including servers on private VPNs, home labs, and internal networks.
Q: What happens to data if the LUKS container runs out of space?
Mallard will return errors on write (DuckDB INSERT and Parquet COPY TO will fail). Flush failures are counted in the mallard_flush_failures_total Prometheus metric. In-memory buffered events are preserved and retried. To prevent this, monitor disk usage and enable MALLARD_RETENTION_DAYS to automatically delete old partitions.
Q: Can I enable Let's Encrypt staging to test without hitting rate limits?
Yes. In deploy/Caddyfile, uncomment:
acme_ca https://acme-staging-v02.api.letsencrypt.org/directory
Your browser will show a certificate warning (staging certs aren't trusted), but you can verify the issuance flow. Remove the line and docker compose restart caddy to switch back to production.
Q: How do I integrate this with Grafana or another dashboard?
Use the Prometheus /metrics endpoint as a data source. For detailed analytics data, the JSON export endpoint (GET /api/stats/export?format=json) produces daily rollups that can be ingested into any TSDB.
Index
| Term | Section |
|---|---|
| A record | Domain and DNS |
| ACME | Caddy and TLS |
| Admin password | FAQ — change password |
| Backup | Backup and restore |
| Caddy | Architecture, Caddy and TLS |
| Certificate renewal | Certificate renewal |
| Cloudflare API token | Cloudflare API token |
| Configuration | Configuration Reference |
| crypttab | After reboot |
| DNS-01 challenge | Cloudflare DNS challenge |
| Docker Compose | One-Command Deployment |
| fail2ban | SSH hardening |
| Firewall | Firewall (UFW) |
| GeoIP | GeoIP setup |
| Health check | Monitoring |
| HTTP/3 QUIC | Architecture |
| Kernel hardening | Kernel parameters |
| LUKS encryption | LUKS Encrypted Volume |
| Logging | View logs |
| Metrics (Prometheus) | Monitoring |
| Multi-site | FAQ — multiple sites |
| Resize volume | Resizing the volume |
| setup.sh | What setup.sh Does |
| SSH key | SSH key access |
| TLS | Caddy and TLS |
| Tracking script | Adding the Tracking Script |
| UFW | Firewall (UFW) |
| Updates | Update Mallard Metrics |
| vps-audit | vps-audit integration |
| Wildcard certificate | FAQ — wildcard certificate |
Fly.io Deployment
Fly.io is a managed application platform that runs Docker containers in hardware-isolated micro-VMs (Firecracker) across a global network. It is not a "free tier" service — it requires a credit card. However, its Hobby plan includes enough free allowances to run Mallard Metrics at low-to-medium traffic volumes at little or no monthly cost.
Overview
Fly.io runs your Docker image as a Firecracker micro-VM. Mallard Metrics deploys well because:
- The
FROM scratchmusl-static binary has no OS dependencies - Fly.io provides persistent volumes for DuckDB and Parquet data
- Fly.io terminates TLS automatically — no Caddy or certbot needed
- The Fly.io edge network handles HTTP/2 and HTTPS globally
- Machines auto-start on traffic and can auto-stop when idle
Limitations compared to a dedicated VPS:
- No LUKS encryption (volume encryption is managed by Fly.io's infrastructure)
- Auto-stop means cold-start latency if traffic is infrequent
- Volume size and I/O throughput are lower than a dedicated disk
- Scaling beyond a single machine requires paid plan upgrades
Fly.io vs VPS: When to Choose Each
| Criterion | Fly.io | Dedicated VPS |
|---|---|---|
| Setup time | < 15 minutes | 30–60 minutes |
| Monthly cost (light traffic) | ~$0–$5 | $4–$10 |
| TLS management | Automatic | Caddy (setup.sh handles) |
| Data encryption at rest | Platform-managed | LUKS (user-managed) |
| Cold-start latency | Yes (if auto-stop) | No |
| Custom kernel tuning | No | Yes |
| Multi-region | Yes | Manual |
| Persistent storage | Volumes (3 GB included) | LUKS image (you size it) |
| SSH access | fly ssh console | Direct SSH |
Choose Fly.io if you want zero infrastructure maintenance and are comfortable with platform-managed data storage.
Choose a VPS if you need full control, LUKS encryption, or higher data volumes.
Pricing and Allowances
Fly.io's Hobby plan (requires a payment method) includes monthly allowances:
| Resource | Included free |
|---|---|
| Shared-CPU-1x 256 MB VMs | 3 VMs |
| Persistent volume storage | 3 GB |
| Outbound data transfer | 160 GB |
| TLS certificates | Unlimited |
Mallard Metrics needs:
- 1 VM —
shared-cpu-1xwith 256 MB RAM is sufficient for up to ~10k daily events. Scale to 512 MB or 1x CPU for higher loads. - 1 Volume — minimum 1 GB (DuckDB grows with data). 3 GB is comfortable for a year of moderate traffic.
At low traffic, your deployment may fit entirely within the free allowances. At higher traffic or with a large data volume, expect $1–5/month.
Prerequisites
- A Fly.io account — sign up at fly.io (credit card required)
- flyctl installed on your local machine
- The mallardmetrics repository cloned locally
- A domain name (optional — Fly.io provides a
.fly.devsubdomain for free)
Initial Setup
Install flyctl
macOS:
brew install flyctl
Linux:
curl -L https://fly.io/install.sh | sh
# Add to PATH (add this to ~/.bashrc or ~/.zshrc)
export PATH="$HOME/.fly/bin:$PATH"
Windows:
iwr https://fly.io/install.ps1 -useb | iex
Verify:
fly version
Authenticate
fly auth login
# Opens a browser — log in to your Fly.io account
Configure the Application
fly.toml
Create fly.toml in the repository root:
# Mallard Metrics — Fly.io configuration
# Replace "mallard-metrics-YOURNAME" with a globally unique app name.

app            = "mallard-metrics-YOURNAME"
primary_region = "ord"    # Chicago. See: fly platform regions

[build]
  # Use the existing Dockerfile (FROM scratch, musl binary)
  dockerfile = "Dockerfile"

[env]
  # Non-secret configuration — secrets go in fly secrets (see below)
  # IMPORTANT: env var names must match config.rs exactly:
  #   MALLARD_RATE_LIMIT  → config.rate_limit_per_site  (NOT _PER_SITE suffix)
  #   MALLARD_CACHE_TTL   → config.cache_ttl_secs        (NOT _SECS suffix)
  #   MALLARD_GEOIP_DB    → config.geoip_db_path          (NOT _PATH suffix)
  MALLARD_DATA_DIR           = "/data"
  MALLARD_HOST               = "0.0.0.0"
  MALLARD_PORT               = "8080"
  MALLARD_LOG_FORMAT         = "json"
  MALLARD_FILTER_BOTS        = "true"
  MALLARD_SECURE_COOKIES     = "true"
  MALLARD_RETENTION_DAYS     = "365"
  MALLARD_RATE_LIMIT         = "200"
  MALLARD_CACHE_TTL          = "300"
  MALLARD_MAX_LOGIN_ATTEMPTS = "5"
  MALLARD_LOGIN_LOCKOUT      = "300"
  RUST_LOG                   = "mallard_metrics=info,tower_http=warn"

[http_service]
  internal_port       = 8080
  force_https         = true       # Fly.io handles TLS; redirect HTTP → HTTPS
  auto_stop_machines  = "stop"     # Stop idle machines to save cost
  auto_start_machines = true       # Auto-start on new traffic
  min_machines_running = 1         # Keep at least 1 machine alive (prevents cold starts)
  processes            = ["app"]

  [http_service.concurrency]
    type       = "requests"
    soft_limit = 200
    hard_limit = 250

[[vm]]
  cpu_kind = "shared"
  cpus     = 1
  memory   = "256mb"     # Increase to "512mb" for >50k daily events

[mounts]
  source      = "mallard_data"    # Volume name (created below)
  destination = "/data"
  initial_size = "3gb"

[checks]
  [checks.health]
    grace_period = "10s"
    interval     = "30s"
    method       = "GET"
    path         = "/health/ready"
    port         = 8080
    timeout      = "5s"
    type         = "http"
Choose your region (primary_region):
fly platform regions
# Pick the region closest to your users or your DNS provider
# Common choices: ord (Chicago), iad (Virginia), lax (Los Angeles),
#                 lhr (London), fra (Frankfurt), nrt (Tokyo), sin (Singapore)
Dockerfile note
The existing Dockerfile targets x86_64-unknown-linux-musl. Fly.io runs on x86-64 by default — no changes to the Dockerfile are needed.
If you want to build for Fly.io's ARM machines (--vm-cpu-kind performance), change the target to aarch64-unknown-linux-musl and update the rust-toolchain.toml accordingly.
Create a Persistent Volume
The Fly.io volume stores DuckDB and Parquet data between deployments and machine restarts.
# Create a 3 GB volume in your primary region (included in Hobby allowances)
fly volumes create mallard_data \
  --size 3 \
  --region ord \
  --app mallard-metrics-YOURNAME

# Verify
fly volumes list --app mallard-metrics-YOURNAME
Important: Volumes are single-region and single-machine by default. If you scale to multiple machines, each machine needs its own volume — but Mallard Metrics is a single-instance application (DuckDB is embedded). Do not scale to more than 1 machine without understanding the data consistency implications.
Set Secrets
Fly.io secrets are encrypted at rest and injected as environment variables at runtime. Never put secrets in fly.toml.
APP=mallard-metrics-YOURNAME

# Required secrets — generate strong values:
fly secrets set \
  MALLARD_SECRET="$(openssl rand -base64 48)" \
  MALLARD_ADMIN_PASSWORD="$(openssl rand -base64 24 | tr -d '=+/' | head -c 32)" \
  MALLARD_METRICS_TOKEN="$(openssl rand -hex 32)" \
  --app "$APP"
Save the admin password before running the above — it is not retrievable after setting:
# Generate and save before setting:
ADMIN_PASS="$(openssl rand -base64 24 | tr -d '=+/' | head -c 32)"
echo "Admin password: $ADMIN_PASS"  # Save this!
fly secrets set MALLARD_ADMIN_PASSWORD="$ADMIN_PASS" --app "$APP"
To update a secret later:
fly secrets set MALLARD_ADMIN_PASSWORD="new-password" --app "$APP"
# Fly.io triggers a rolling restart automatically
To view which secrets are set (names only — values are never shown):
fly secrets list --app "$APP"
Deploy
# From the repository root directory
fly deploy --app mallard-metrics-YOURNAME

# Or launch for the first time (creates app + prompts for config):
fly launch
# Answer the prompts; Fly.io will detect the Dockerfile and suggest settings.
# Review the generated fly.toml and adjust as described above.
Fly.io will:
- Build the Docker image remotely (using Fly's build infrastructure)
- Push it to Fly.io's container registry
- Create a Firecracker micro-VM from the image
- Mount the
mallard_datavolume at/data - Inject secrets as environment variables
- Start the machine and run health checks
Deployment typically takes 2–4 minutes. Watch progress:
fly deploy --app mallard-metrics-YOURNAME 2>&1 | tee deploy.log
Configure a Custom Domain
By default your app is available at https://mallard-metrics-YOURNAME.fly.dev.
To use a custom domain:
# 1. Add the domain to your Fly.io app
fly certs add analytics.example.com --app mallard-metrics-YOURNAME

# 2. Fly.io will show you the DNS records to create:
fly certs show analytics.example.com --app mallard-metrics-YOURNAME
Create the DNS records shown (usually a CNAME to <app>.fly.dev or an A/AAAA to Fly's IPs). Fly.io obtains a Let's Encrypt certificate automatically via the HTTP-01 or DNS-01 challenge.
Update the app to know its domain:
fly secrets set \
  MALLARD_DASHBOARD_ORIGIN="https://analytics.example.com" \
  --app mallard-metrics-YOURNAME
Verify the Deployment
# Check machine status
fly status --app mallard-metrics-YOURNAME

# View machine health
fly checks list --app mallard-metrics-YOURNAME

# Quick smoke test
curl -s https://mallard-metrics-YOURNAME.fly.dev/health/ready
# Expected: ready

# View all available endpoints
curl -s https://mallard-metrics-YOURNAME.fly.dev/health/detailed | jq .
Open https://mallard-metrics-YOURNAME.fly.dev (or your custom domain) in a browser. Log in with the admin password you set.
Logs and Monitoring
# Stream live logs
fly logs --app mallard-metrics-YOURNAME

# Historical logs (last N lines)
fly logs --app mallard-metrics-YOURNAME -n 200

# Parse JSON structured logs
fly logs --app mallard-metrics-YOURNAME | jq 'select(.fields.uri != "/health/ready")'

# Machine console (SSH equivalent — note: FROM scratch has no shell)
# Use this to inspect the volume contents:
fly ssh console --app mallard-metrics-YOURNAME
# > ls /data/
Prometheus metrics:
METRICS_TOKEN=$(fly secrets list --app mallard-metrics-YOURNAME | grep METRICS_TOKEN)
curl -H "Authorization: Bearer $YOUR_METRICS_TOKEN" \
  https://mallard-metrics-YOURNAME.fly.dev/metrics
Fly.io built-in monitoring:
The Fly.io dashboard at fly.io/apps/YOUR-APP shows:
- Machine CPU and memory graphs
- HTTP request rate and latency
- Health check pass/fail history
Scaling and Regions
Increase VM memory (if DuckDB queries are slow or OOMing):
# Edit fly.toml:
# [[vm]]
#   memory = "512mb"   # or "1gb"

fly deploy  # Apply the change
Prevent cold starts (machine auto-stops when idle):
# In fly.toml, ensure:
# [http_service]
#   min_machines_running = 1
This keeps 1 machine always running, eliminating cold-start latency at the cost of ~1 machine's worth of compute (within Hobby allowances).
Multi-region (advanced):
Fly.io supports deploying machines in multiple regions for lower global latency. However, Mallard Metrics uses an embedded single-file DuckDB database — volumes cannot be shared across regions. Multi-region deployment is not recommended without a replication strategy.
Updating Mallard Metrics
# Pull latest changes
git pull origin main

# Deploy (Fly.io builds the new image and does a rolling restart)
fly deploy --app mallard-metrics-YOURNAME

# Monitor the deploy
fly status --app mallard-metrics-YOURNAME
fly logs --app mallard-metrics-YOURNAME
Fly.io performs a blue/green-style deploy — it starts the new machine, runs health checks, and only terminates the old machine once the new one is healthy. Downtime is typically < 5 seconds.
Backup and Restore
Fly.io volumes are not automatically backed up. Back up the DuckDB file and Parquet data regularly.
Export via API (for structured backup):
# CSV export of all data
curl -H "Authorization: Bearer $API_KEY" \
  "https://mallard-metrics-YOURNAME.fly.dev/api/stats/export?site_id=example.com&format=json" \
  > backup-$(date +%Y%m%d).json
Volume snapshot (Fly.io feature):
# List volumes
fly volumes list --app mallard-metrics-YOURNAME

# Create a snapshot (may cause brief I/O pause)
fly volumes snapshots create <VOLUME_ID> --app mallard-metrics-YOURNAME

# List snapshots
fly volumes snapshots list <VOLUME_ID> --app mallard-metrics-YOURNAME
Restore from snapshot:
# Create a new volume from snapshot
fly volumes create mallard_data_restore \
  --snapshot-id <SNAPSHOT_ID> \
  --size 3 \
  --region ord \
  --app mallard-metrics-YOURNAME
Troubleshooting
Machine fails to start
fly logs --app mallard-metrics-YOURNAME | tail -50

# Common causes:
# 1. MALLARD_SECRET not set — run: fly secrets list
# 2. Volume not found — run: fly volumes list
# 3. Port mismatch — ensure MALLARD_PORT=8080 matches fly.toml internal_port=8080
Health checks failing
fly checks list --app mallard-metrics-YOURNAME

# Test the endpoint manually
fly ssh console --app mallard-metrics-YOURNAME
# Inside the console (if you have a shell):
wget -qO- http://localhost:8080/health/ready
# Note: FROM scratch has no shell — use fly proxy instead:
fly proxy 8080 --app mallard-metrics-YOURNAME
# Then in another terminal: curl http://localhost:8080/health/ready
Volume not mounted / data missing after update
# Check the mount
fly ssh console --app mallard-metrics-YOURNAME
ls /data/

# If /data is empty, the volume may have been detached
# Verify volume attachment in fly.toml [mounts] section matches the volume name
fly volumes list --app mallard-metrics-YOURNAME
Out of disk space on volume
# Extend the volume (Fly.io allows online resize)
fly volumes extend <VOLUME_ID> --size 10 --app mallard-metrics-YOURNAME

# Enable retention to prune old data
fly secrets set MALLARD_RETENTION_DAYS=180 --app mallard-metrics-YOURNAME
Machine auto-stopped unexpectedly
# Check if auto_stop_machines is enabled in fly.toml
# Ensure min_machines_running = 1 to prevent full auto-stop

# Or disable auto-stop entirely:
# [http_service]
#   auto_stop_machines = false
Frequently Asked Questions
Q: Does Fly.io encrypt volume data at rest?
Yes — Fly.io encrypts all volume data at rest using AES-256. You do not need to manage LUKS yourself. For compliance requirements, consult Fly.io's security documentation.
Q: Do I need a credit card?
Yes. Fly.io requires a payment method for all accounts, including those that stay within the free allowances. There is no truly card-free free tier.
Q: What is the cold-start latency?
When auto_stop_machines = "stop" and min_machines_running = 0, an idle machine is stopped after ~5 minutes. The first request after that triggers a cold start — typically 2–5 seconds for the Firecracker VM to boot. For an analytics ingestion endpoint, this means some requests may be delayed or dropped during cold start. Set min_machines_running = 1 to keep the machine always warm.
Q: Can I use Fly.io without a custom domain?
Yes. Fly.io provides a free *.fly.dev subdomain with a valid TLS certificate. Use it in your tracking script and dashboard URL.
Q: How do I SSH into the machine?
fly ssh console --app mallard-metrics-YOURNAME
Note that the Mallard container is FROM scratch and has no shell. The fly ssh console command connects to the VM's outer shell (not the container), so you can run ls / but not exec into the container.
To inspect the data volume:
fly ssh console --app mallard-metrics-YOURNAME
ls /data/         # See DuckDB and Parquet files
du -sh /data/     # Check usage
Q: Can I run Mallard Metrics alongside other services?
Fly.io apps are isolated. You can deploy other services as separate Fly apps in the same organisation and they share the same billing account. Each service gets its own machine(s) and volume(s).
Q: How do I migrate from Fly.io to a VPS?
- Export your data via the API (
/api/stats/export) - Or copy the volume contents: create a volume snapshot, restore it locally
- Copy
mallard.duckdband the Parquet data directory to your VPS LUKS volume - Follow the VPS Deployment Guide
Q: Does the behavioral extension work on Fly.io?
Yes, if the behavioral extension binary is included in the build. Check GET /health/detailed — "behavioral_extension_loaded": true confirms it loaded successfully.
Q: What happens to in-flight events if the machine is auto-stopped?
Mallard handles SIGTERM with a graceful shutdown — it flushes the in-memory event buffer to Parquet before the machine stops. As long as the shutdown completes within MALLARD_SHUTDOWN_TIMEOUT_SECS (default 30s), no events are lost. Events buffered after the flush starts may be lost. Set min_machines_running = 1 to avoid auto-stop entirely for high-reliability deployments.
Monitoring
Health Checks
Three health endpoints are available without authentication:
GET /health
Returns ok with HTTP 200 when the server is running. Use this for:
- Load balancer health checks.
- Container orchestrator liveness probes.
# Kubernetes liveness probe
livenessProbe:
  httpGet:
    path: /health
    port: 8000
  initialDelaySeconds: 5
  periodSeconds: 10
GET /health/ready
Executes a lightweight DuckDB query (SELECT 1 FROM events_all LIMIT 0) to verify the database is operational. Returns:
200 OK— database is ready and accepting queries.503 Service Unavailable— database is not ready (use this as a readiness probe, not liveness).
# Kubernetes readiness probe
readinessProbe:
  httpGet:
    path: /health/ready
    port: 8000
  initialDelaySeconds: 10
  periodSeconds: 15
  failureThreshold: 3
GET /health/detailed
Returns a JSON object with component-level status. See Health & Metrics API for the full schema.
Prometheus Metrics
GET /metrics returns Prometheus text format metrics (text/plain; version=0.0.4).
If MALLARD_METRICS_TOKEN is set, this endpoint requires Authorization: Bearer <token>.
Gauges
| Metric | Type | Description |
|---|---|---|
mallard_buffered_events | gauge | Events in memory, not yet flushed to Parquet |
mallard_cache_entries | gauge | Cached query results in memory |
mallard_auth_configured | gauge | 1 if admin password is set, 0 otherwise |
mallard_geoip_loaded | gauge | 1 if GeoIP database loaded successfully |
mallard_filter_bots | gauge | 1 if bot filtering is active |
mallard_behavioral_extension | gauge | 1 if behavioral extension loaded, 0 otherwise |
Counters
| Metric | Type | Description |
|---|---|---|
mallard_events_ingested_total | counter | Total events accepted through POST /api/event |
mallard_flush_failures_total | counter | Total buffer flush failures |
mallard_rate_limit_rejections_total | counter | Total requests rejected by the per-site rate limiter |
mallard_login_failures_total | counter | Total failed login attempts |
mallard_cache_hits_total | counter | Total query cache hits |
mallard_cache_misses_total | counter | Total query cache misses |
Prometheus Scrape Configuration
scrape_configs:
  - job_name: mallard_metrics
    static_configs:
      - targets: ['localhost:8000']
    metrics_path: /metrics
    scrape_interval: 30s
    # If MALLARD_METRICS_TOKEN is set:
    authorization:
      credentials: your-metrics-token
Example Output
# HELP mallard_buffered_events Number of events in the in-memory buffer
# TYPE mallard_buffered_events gauge
mallard_buffered_events 42

# HELP mallard_cache_entries Number of cached query results
# TYPE mallard_cache_entries gauge
mallard_cache_entries 3

# HELP mallard_behavioral_extension Whether behavioral extension is loaded
# TYPE mallard_behavioral_extension gauge
mallard_behavioral_extension 1

# HELP mallard_events_ingested_total Total events ingested
# TYPE mallard_events_ingested_total counter
mallard_events_ingested_total 158432

# HELP mallard_cache_hits_total Total query cache hits
# TYPE mallard_cache_hits_total counter
mallard_cache_hits_total 9871

# HELP mallard_cache_misses_total Total query cache misses
# TYPE mallard_cache_misses_total counter
mallard_cache_misses_total 1204
Grafana Dashboard
A minimal Grafana panel configuration for key metrics:
{
  "panels": [
    {
      "title": "Ingestion Rate",
      "targets": [{"expr": "rate(mallard_events_ingested_total[5m])"}]
    },
    {
      "title": "Buffered Events",
      "targets": [{"expr": "mallard_buffered_events"}]
    },
    {
      "title": "Cache Hit Rate",
      "targets": [{"expr": "rate(mallard_cache_hits_total[5m]) / (rate(mallard_cache_hits_total[5m]) + rate(mallard_cache_misses_total[5m]))"}]
    },
    {
      "title": "Rate Limit Rejections",
      "targets": [{"expr": "rate(mallard_rate_limit_rejections_total[5m])"}]
    }
  ]
}
Structured Logging
Mallard Metrics uses tracing for structured logging. Two formats are supported:
Text (default)
Human-readable output with timestamps, log levels, and structured fields:
2024-01-15T10:00:00.123Z  INFO mallard_metrics: Starting Mallard Metrics host="0.0.0.0" port=8000
2024-01-15T10:00:00.456Z  INFO mallard_metrics: Behavioral extension loaded
2024-01-15T10:00:00.457Z  INFO mallard_metrics: Listening addr="0.0.0.0:8000"
JSON
Set MALLARD_LOG_FORMAT=json for machine-parseable output compatible with log aggregators (Loki, Elasticsearch, Splunk):
{"timestamp":"2024-01-15T10:00:00.123Z","level":"INFO","fields":{"message":"Flushed events to Parquet","count":42},"target":"mallard_metrics::ingest::buffer","request_id":"a3f2c1d8-..."}
Every log line emitted during a request carries a request_id field matching the X-Request-ID response header, enabling end-to-end log correlation.
Log Level Control
Use the RUST_LOG environment variable (standard tracing-subscriber env-filter syntax):
RUST_LOG=mallard_metrics=debug,tower_http=info
Default: mallard_metrics=info,tower_http=info
Alerting Recommendations
| Alert | Condition | Severity |
|---|---|---|
| Server down | up{job="mallard_metrics"} == 0 | Critical |
| Large event buffer | mallard_buffered_events > 5000 | Warning |
| High flush failures | increase(mallard_flush_failures_total[5m]) > 0 | Warning |
| Auth not configured | mallard_auth_configured == 0 | Warning |
| High rate limit rejections | rate(mallard_rate_limit_rejections_total[5m]) > 10 | Info |
| Low cache hit rate | (cache_hits / (cache_hits + cache_misses)) < 0.5 | Info |
| GeoIP not loaded | mallard_geoip_loaded == 0 | Info |
| Behavioral extension missing | mallard_behavioral_extension == 0 | Info |
Data Management
Storage Layout
Events are stored as date-partitioned, ZSTD-compressed Parquet files under data_dir/events/:
data/events/
├── site_id=example.com/
│   ├── date=2024-01-15/
│   │   ├── 0001.parquet   ← first flush for this day
│   │   └── 0002.parquet   ← second flush for this day
│   └── date=2024-01-16/
│       └── 0001.parquet
└── site_id=other.org/
    └── date=2024-01-15/
        └── 0001.parquet
Each Parquet file contains one batch of flushed events for a specific site and date. Files are numbered sequentially within each partition. Parquet files are self-describing and can be read by any Parquet-compatible tool.
Buffer and Flush Lifecycle
flowchart TD
    EVENT["Incoming Event\nPOST /api/event"]
    EVENT --> BUF["In-Memory Buffer\nVec<Event>"]

    BUF --> T1{"Count reached\nflush_event_count?"}
    BUF --> T2{"Periodic timer\nevery flush_interval_secs?"}
    BUF --> T3{"SIGINT or SIGTERM\ngraceful shutdown?"}

    T1 -->|"Yes"| FLUSH
    T2 -->|"Yes"| FLUSH
    T3 -->|"Yes"| FLUSH

    FLUSH["Flush — spawn_blocking\nDuckDB Appender API\nbatch column insert"]
    FLUSH --> PARQUET["COPY TO Parquet\nZSTD compression\ndate-partitioned file"]
    PARQUET --> DELETE["DELETE FROM events\nhot table cleared"]
    DELETE --> VIEW["Refresh events_all VIEW\nglobbed over new Parquet files"]
    VIEW --> READY(["All data queryable\nevents_all VIEW\nhot union cold"])
Failure safety: If the Appender insertion fails, drained events are restored to the front of the buffer and the flush returns an error. No events are lost due to a failed flush attempt.
Flush triggers:
- Event count reaches
flush_event_count(default 1000). - Periodic timer fires every
flush_interval_secs(default 60 seconds). Runs inspawn_blockingto avoid blocking the async runtime. - Graceful shutdown — bounded by
shutdown_timeout_secs(default 30 seconds).
Data Retention
When retention_days is set to a non-zero value, a background task runs daily and removes Parquet partition directories older than the configured threshold.
# Delete partitions older than 90 days
retention_days = 90
What is deleted: the entire date=YYYY-MM-DD/ directory and all Parquet files within it.
What is not deleted: the site_id=*/ parent directory (it remains even if all date partitions have been removed).
To keep data indefinitely, set retention_days = 0 (the default).
GDPR Right to Erasure
Mallard Metrics provides an admin-authenticated DELETE /api/gdpr/erase endpoint to permanently delete analytics data for a given site_id within a date range. Because visitor IDs are pseudonymous daily-rotating HMAC hashes that cannot be reverse-mapped to individuals, erasure operates at the site + date-range granularity — the finest granularity available without the original IP address and User-Agent. See PRIVACY.md for the full analysis and operator obligations.
Backup and Restore
Parquet files are self-describing and portable. To back up:
# Sync data directory to a backup location
rsync -a --checksum /data/events/ /backup/mallard-events/

# Or with rclone to S3
rclone sync /data/events s3:my-bucket/mallard-events
To restore:
rsync -a /backup/mallard-events/ /data/events/
After restore, restart Mallard Metrics. The events_all VIEW automatically picks up all Parquet files on startup.
Tip: Include
data/mallard.duckdbanddata/mallard.duckdb.walin your backups to preserve any hot (not yet flushed) events.
Inspecting Data with DuckDB CLI
You can query Parquet files directly with the DuckDB CLI, independent of the Mallard Metrics server:
duckdb

-- Daily visitor and pageview counts for a site
SELECT
    CAST(timestamp AS DATE) AS date,
    COUNT(DISTINCT visitor_id)                            AS visitors,
    COUNT(*) FILTER (WHERE event_name = 'pageview')       AS pageviews
FROM read_parquet('data/events/site_id=example.com/**/*.parquet')
GROUP BY date
ORDER BY date DESC;

-- Top pages last 30 days
SELECT pathname, COUNT(*) AS views
FROM read_parquet('data/events/site_id=example.com/**/*.parquet')
WHERE event_name = 'pageview'
  AND CAST(timestamp AS DATE) >= CURRENT_DATE - INTERVAL 30 DAYS
GROUP BY pathname
ORDER BY views DESC
LIMIT 20;

-- Revenue by product
SELECT
    json_extract_string(props, '$.product') AS product,
    SUM(revenue_amount)                      AS total_revenue,
    COUNT(*)                                 AS transactions
FROM read_parquet('data/events/site_id=example.com/**/*.parquet')
WHERE event_name = 'purchase'
GROUP BY product
ORDER BY total_revenue DESC;
Schema
The events table schema (also the Parquet file schema):
| Column | Type | Nullable | Description |
|---|---|---|---|
site_id | VARCHAR | No | Site identifier |
visitor_id | VARCHAR | No | HMAC-SHA256 privacy-safe visitor ID |
timestamp | TIMESTAMP | No | UTC event timestamp |
event_name | VARCHAR | No | Event type (e.g. pageview, signup) |
pathname | VARCHAR | No | URL path |
hostname | VARCHAR | Yes | URL hostname |
referrer | VARCHAR | Yes | Referrer URL |
referrer_source | VARCHAR | Yes | Parsed referrer source name |
utm_source | VARCHAR | Yes | UTM source parameter |
utm_medium | VARCHAR | Yes | UTM medium parameter |
utm_campaign | VARCHAR | Yes | UTM campaign parameter |
utm_content | VARCHAR | Yes | UTM content parameter |
utm_term | VARCHAR | Yes | UTM term parameter |
browser | VARCHAR | Yes | Browser name |
browser_version | VARCHAR | Yes | Browser version string |
os | VARCHAR | Yes | Operating system name |
os_version | VARCHAR | Yes | OS version string |
device_type | VARCHAR | Yes | desktop, mobile, or tablet |
screen_size | VARCHAR | Yes | Screen viewport width in pixels (e.g. 1920) |
country_code | VARCHAR(2) | Yes | ISO 3166-1 alpha-2 country code |
region | VARCHAR | Yes | Region/state name |
city | VARCHAR | Yes | City name |
props | VARCHAR | Yes | Custom properties (JSON string, queryable via json_extract) |
revenue_amount | DECIMAL(12,2) | Yes | Revenue amount |
revenue_currency | VARCHAR(3) | Yes | ISO 4217 currency code |